Question
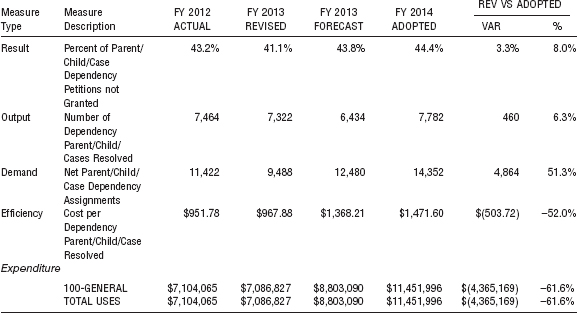
1. Maricopa Countys Public Defense Services Agency (the public defenders office) tracks performance metrics very closely. Table 9.2 is from the FY [Fiscal Year] 2014

1. Maricopa Countys Public Defense Services Agency (the public defenders office) tracks performance metrics very closely. Table 9.2 is from the FY [Fiscal Year] 2014 Annual Business Strategies: Adopted Budget document. Examine the trends and the connections between the measures and the expenditure dollars. Does the FY 2014 adopted budget seem reasonable? TABLE 9.2 Maricopa County Public Defense Services Agency Performance Measures Note: FY 2013 Revised refers to the active official budget. FY 2014 Adopted refers to the original budget approved by the Board of Supervisors. Source: http://www.maricopa.gov/Budget/pdf/MCABS2014.pdf (p. 762).
2. Sky High School has significant student dropout and failure rates among its senior-year classes. To address this issue, it has obtained grant funding for the senior class. Because this problem appears to be dispersed across the entire senior class, some elements of the program serve all the seniors, even those who appear successful and on track toward graduation throughout the year. The objective of the program is for the students to complete the senior year and graduate. Success of this retention program is determined to be graduation. The data in Table 9.3 are available. TABLE 9.3 Sky High School Senior Class Retention Program Performance Measures Please provide measures of process and financial measures of efficiency and effectiveness. Is the Sky High School guidance office making progress towards its mission? Why or why not?
Step by Step Solution
There are 3 Steps involved in it
Step: 1

Get Instant Access to Expert-Tailored Solutions
See step-by-step solutions with expert insights and AI powered tools for academic success
Step: 2

Step: 3

Ace Your Homework with AI
Get the answers you need in no time with our AI-driven, step-by-step assistance
Get Started


