

Question
1. Moon around the Earth (20 pts) Use the code we did in class on Week 3 for the Earth around the Sun (using Verlet)
1. Moon around the Earth (20 pts)
Use the code we did in class on Week 3 for the Earth around the Sun (using Verlet) and modify it for the Moon around the Earth (you can also use the code below as starting point if you like). use an integration time of 0.2 days, that is =0.2246060dtm=0.2246060, Consider that the distance to the Moon is 384,400 km and that the velocity of the moon is about 1km/s, much smaller than that of the earth around the sun (30 km/s).
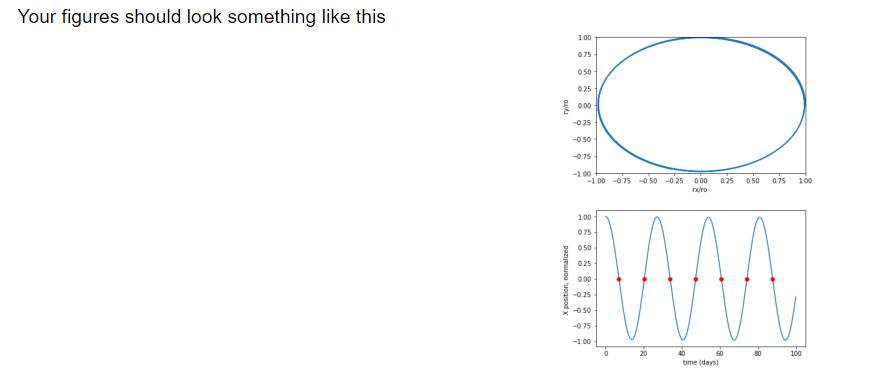
1a) Use your new code to Plot the trajectory of the moon around the earth and a second plot where the x position is plotted as a function of time.
1b) Use the interpolation equation from the last homework to calculate same as we did there, the period of rotation.
1c) You will notice that the period is a bit smaller than the real period of 27.3 days. This is because we use an approximated velocity of 1km/s. Vary the moon's velocity in the code, to find out what is the exact real velocity so that the period is 27.3 days.
1 Extra credit. 15 pts.
Use the JavaScript code we did in class for the earth and the sun and modify it to do the earth and the moon.
1 Extra credit. 40 pts.
Create a code that solves the dynamics of the earth around the sun with the moon around the earth. You can write the code in Python and/or Java-Script.
code:
from math import * import numpy as np import matplotlib.pyplot as plt from matplotlib import animation import matplotlib.pyplot as plt import matplotlib.patches as patches import matplotlib as mpl %matplotlib inline
Me=5.9722e24 ; G=6.6738e-11; interval = ; # 1 means one day dtm= interval*24.*60.*60.; time=500;
rmx= np.zeros(time); rmy= np.zeros(time); vmx= np.zeros(time); vmy= np.zeros(time); ntime=np.zeros(time); zeros = np.zeros(time); n=0;
rmo= ; # distance Earth to Moon rmx[0]=rmo; rmy[0]=0; vmo= ; # Velocity of Moon vmx[0]=0; vmy[0]=vmo;
def getRrRr3(i): rr = ; rr3 = ; return rr,rr3 ;
for i in range(1, time): rr, rr3 = getRrRr3(i-1) ; rmx[i]= ; rmy[i]= ; rr, rr3 = getRrRr3(i-1) ; vmx[i]= ; vmy[i]= ; ntime[i]=i*dtm/(60*60*24); if (i >2 and rmx[i]*rmx[i-1])
xzeros=np.zeros(n); yzeros=np.zeros(n); for i in range(0,n): xzeros[i]=zeros[i]/(60*60*24); if ( i > 1): print(xzeros[i]-xzeros[i-2]);
plt.xlabel('rx/ro ') plt.ylabel('ry/ro ') plt.xlim(-1, 1) plt.ylim(-1, 1) plt.plot(rmx/rmo,rmy/rmo) plt.show()
plt.plot(ntime,rmx/rmo) plt.plot(xzeros,yzeros, "ro") plt.xlabel('time (days)') plt.ylabel('X position, normalized ') plt.show()
Your figures should look something like this 1.00 075 0.50 025 025 -0 50 -o75 1.00-075 -0 50 025 000 025 050 075 100 100 0.75 0 50 0.25 0.25 -0.75 time (days Your figures should look something like this 1.00 075 0.50 025 025 -0 50 -o75 1.00-075 -0 50 025 000 025 050 075 100 100 0.75 0 50 0.25 0.25 -0.75 time (daysStep by Step Solution
There are 3 Steps involved in it
Step: 1

Get Instant Access to Expert-Tailored Solutions
See step-by-step solutions with expert insights and AI powered tools for academic success
Step: 2

Step: 3
Ace Your Homework with AI
Get the answers you need in no time with our AI-driven, step-by-step assistance
Get Started
Spatio Temporal Database Management International Workshop Stdbm 99 Edinburgh Scotland September 10 11 1999 Proceedings Lncs 1678
Authors: Michael H. Bohlen ,Christian S. Jensen ,Michel O. Scholl
1999th Edition