

1. Need to have at least 3 out of 5 attributes better than the benchmark (row...
Fantastic news! We've Found the answer you've been seeking!
Question:

Transcribed Image Text:
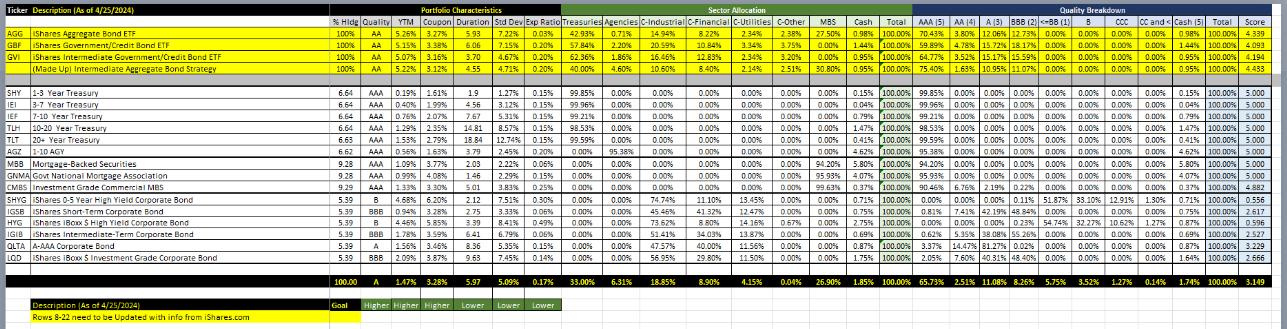
1. Need to have at least 3 out of 5 attributes better than the benchmark (row 26, Cells D-I), duration can be longer if you feel that the yields will drop 2. A minimum of 12 ETFS need to be used to build your portfolio, maximum allocation to AAA securities should be 10% and corporate ETFs be 7%, minimum allocation 2% across all ETFS 3. State the fees you plan to charge your client, your YTM need to exceed the benchmark's by at least that much 4. Your portfolio should be within two credit quality gradations versus the benchmark 5. State the environments when your portfolio will out and underperform the benchmark 6. Your outlook on the bond market (based on your benchmark) in the near term through the end of 2024 a paragraph, state various reasons: Fed expectations, Economy, Geopolitical factors, Investor behavior, Consumer sentiment, Supply chain disruptions, etc. Ticker Description (As of 4/25/2024) AGG Shares Aggregate Bond ETF GBF iShares Government/Credit Band ETF GVI iShares Intermediate Government/Credit Bond ETF (Made Up) Intermediate Aggregate Bond Strategy SHY 1-3 Year Treasury Portfolio Characteristics 100% AA 100% AA 100% AA AA 5.26% 3.27% 5.15% 3.38% 5.07% 3.16% 5.22 % 3.12% 0.20% 57.84% 2.20% Sector Allocation % Hide Quality YTM Coupon Duration Std Dev Exp Ratio Treasuries Agencies C-Industrial C-Financial C-Utilities C-Other MBS 5.93 7,22 % 0.03% 42.93% 0.71% 6.06 7.15% 3.70 4.67% 0.20% 62.36% 1.86% 4.55 4.71% 40.00% Quality Breakdown 14.94% 8.22% 20.59% 10.84% 2.34% 3.34% 16.46% 4.60% 10.60% 8.40% 2.14% 2.34% 3.20% 0.00% 30.80% AAA (5) AA [4] 2.38% 27.50% 0.98% 100.00% 70.43% 3.80% 3.75% 0.00% 1.44% 100.00% 59.89% 4.78% 0.95% 100.00% 64.77% 3.52 % 0.95% 100.00% 75.40% 1.63% Cash Total A (3) 888 (2)-88 (1) 12.06% 12.73% 0.00% 15.72 % 18.17 % 0.00 % 15.17 % 15.59 % 0.00 % 10.95% 11.07% 0.00% 0.00% COC CC and Cash (5) Total Score 0.00% 0.00% 0.98% 100.00% 4.339 0.00% 1.44% 100.00% 4.093 0.00% 0.00% 0.00% 0.95% 100.00% 4.194 0.00% 0.00% 0.00% 0.95% 100.00% 4.433 6.64 AAA 0.19 % TLH 3-7 Year Treasury IEF 7-10 Year Treasury 10-20 Year Treasury TLT 20+ Year Treasury AGZ 6.64 1.61% 0.40% 1.99% 1.9 6.64 AAA 0.76% 2.07% 1.27% 0.15% 4.56 3.12% 0.15% 99.96% 0.00% 5.31% 0.15% 99.21% 99.85% 0.00% 0.00% 0.00% 0.00% 0.00% 0.00% 0.00% 0.00% 0.00% 0.00% 0.00% 0.00% 0.00% 0.00% 0.00% 6.64 AAA 6.63 HYG 1-10 AGY MBB Mortgage-Backed Securities GNMA Govt National Mortgage Association CMBS Investment Grade Commercial MBS SHYG Shares 0-5 Year High Yield Corporate Bond IGSB Shares Short Term Corporate Bond Shares iBoxx $ High Yield Corporate Bond IGIB iShares Intermediate-Term Corporate Bond QLTA A-AAA Corporate Bond 6.62 9.28 9.28 9.29 5.39 5.39 LQD iShares iBoxx $ Investment Grade Corporate Bond 888 5.39 B 5.39 BBB 5.39 A 5.39 BBB 2.35% AAA 1.53% 2.79% AAA 0.56% 1.63% AAA 1.09% 3.77% AAA 0.99% 4.08% AAA 1.33% 3.30% 4.68% 6.20% 0.94% 3.28% 4.45% 5.85% 14.81 18.84 3.79 0.15% 98.53% 12.74% 0.15% 2.45% 0.20% 0.00% 0.00% 0.00% 0.00% 0.00% 0.00% 0.00% 0.00% 0.00% 0.00% 0.00% 0.00% 0.00% 0.00% 95.38% 0.00% 0.00% 2.03 2.22% 0.06% 146 2.29% 0.15% 0.00% 0.00% 0.00% 0.00% 0.00% 0.00% 0.00% 94.20% 5.80% 0.15% 100.00% 99.85% 0.00% 0.00% 0.00% 0.04% 100.00% 99.96% 0.00% 0.00% 0.00% 0.79% 100.00% 99.21% 0.00% 0.00% 0.00% 1.47% 100.00% 98.53% 0.00% 0.00% 0.00% 0.41% 100.00% 99.59% 0.00% 0.00% 0.00% 4.62% 100,00% 95.38% 100.00%|| 94.20% 0.00% 0.00% 0.00% 0.00% 0.15% 100.00% 5.000 0.00% 0.00% 0.00% 0.00% 0.04% 100.00% 5.000 0.00% 0.00% 0.00% 0.00% 0.00% 0.00% 0.00% 0.00% 0.00% 0.00% 0.00% 0.00% 0.00% 0.00% 0.00% 0.00% 0.00% 0.79% 100.00% 5.000 1.47% 100.00% 5.000 0.41% 100.00% 5.000 4.62% 100.00% 5.000 0.00% 5.80% 100.00% 5.000 0.00% 0.00% 0.00% 0.00% 5.01 1.78% 3.59% 1.56% 3.46% 2.09% 3.87% 3.83% 0.25% 7.51% 0.30% 2.75 3.33% 0.06% 3.39 8.41% 0.49% 6.41 6.79% 0.06% 8.36 5.35% 0.15% 9.63 7.45% 0.14% 0.00% 0.00% 0.00% 0.00% 0.00% 0.00% 0.00% 0.00% 74.74% 45.45% 0.00% 0.00% 73.62% 0.00% 0.00% 51.41% 0.00% 0.00% 47.57% 0.00% 0.00% 56.95% 40.00% 29.80% 0.00% 11.10% 13.45% 0.00% 41.32% 12.47% 0.00% 8.80% 14.16% 067% 34.03% 13.87% 0.00% 11.56% 0.00% 11.50% 0.00% 0.00% 0.00% 95.93% 4.07 % 99.63% 0.37% 100.00% 90.46% 0.71% 100.00% 0,75% 100,00% 0.81% 0.00% 2.75% 100.00% 0.00% 0.00% 0.69% 100.00% 0.62% 0.00% 0.87% 100.00% 3.37% 0.00% 1.75% 100.00% 2.05% 100.00% 95.93% 0.00% 0.00% 0.00% 0.00% 0.00% 0.00% 0.00% 4.07% 100.00% 5.000 6.76% 2.19% 0.22% 0.00% 0.00% 0.00% 0.00% 0.00% 0.00% 0.11% 51.87 % 33.10% 12.91 % 1.30% 7.41 % 42.19 % 48.84% 0.00% 0.00% 0.00% 0.00% 0.00% 0.00% 0.23% 54.74% 32.27% 10.62% 1.27% 5.35% 38.08% 55.26% 0.00% 0.00% 0.00% 0.00% 14.47 % 81.27% 0.02 % 0.00% 0.00% 0.00% 0.00% 7.60% 40.31% 48.40% 0.00% 0.00% 0.00% 0.00% 0.37% 100.00% 4.882 0.71% 100.00% 0.556 0.75% 100.00% 2.617 0.87% 100.00% 0.596 0.69% 100.00% 2.527 0.87% 100.00% 3.229 1.64% 100.00% 2.666 100.00 A 1.47% 3.28% 5.97 5.09% 0.17% 33.00% 6.31 % 18.85% 8.90% 4.15% 0.04% 26.90% 1.85% 100.00% 65.73% 2.51% 11.08% 8.25% 5.75% 3.52% 1.27% 0.14% 1.74% 100.00% 3.149 Description (As of 4/25/2024) Rows 8-22 need to be Updated with info from iShares.com Goal Higher Higher Higher Lower Lower Lower 1. Need to have at least 3 out of 5 attributes better than the benchmark (row 26, Cells D-I), duration can be longer if you feel that the yields will drop 2. A minimum of 12 ETFS need to be used to build your portfolio, maximum allocation to AAA securities should be 10% and corporate ETFs be 7%, minimum allocation 2% across all ETFS 3. State the fees you plan to charge your client, your YTM need to exceed the benchmark's by at least that much 4. Your portfolio should be within two credit quality gradations versus the benchmark 5. State the environments when your portfolio will out and underperform the benchmark 6. Your outlook on the bond market (based on your benchmark) in the near term through the end of 2024 a paragraph, state various reasons: Fed expectations, Economy, Geopolitical factors, Investor behavior, Consumer sentiment, Supply chain disruptions, etc. Ticker Description (As of 4/25/2024) AGG Shares Aggregate Bond ETF GBF iShares Government/Credit Band ETF GVI iShares Intermediate Government/Credit Bond ETF (Made Up) Intermediate Aggregate Bond Strategy SHY 1-3 Year Treasury Portfolio Characteristics 100% AA 100% AA 100% AA AA 5.26% 3.27% 5.15% 3.38% 5.07% 3.16% 5.22 % 3.12% 0.20% 57.84% 2.20% Sector Allocation % Hide Quality YTM Coupon Duration Std Dev Exp Ratio Treasuries Agencies C-Industrial C-Financial C-Utilities C-Other MBS 5.93 7,22 % 0.03% 42.93% 0.71% 6.06 7.15% 3.70 4.67% 0.20% 62.36% 1.86% 4.55 4.71% 40.00% Quality Breakdown 14.94% 8.22% 20.59% 10.84% 2.34% 3.34% 16.46% 4.60% 10.60% 8.40% 2.14% 2.34% 3.20% 0.00% 30.80% AAA (5) AA [4] 2.38% 27.50% 0.98% 100.00% 70.43% 3.80% 3.75% 0.00% 1.44% 100.00% 59.89% 4.78% 0.95% 100.00% 64.77% 3.52 % 0.95% 100.00% 75.40% 1.63% Cash Total A (3) 888 (2)-88 (1) 12.06% 12.73% 0.00% 15.72 % 18.17 % 0.00 % 15.17 % 15.59 % 0.00 % 10.95% 11.07% 0.00% 0.00% COC CC and Cash (5) Total Score 0.00% 0.00% 0.98% 100.00% 4.339 0.00% 1.44% 100.00% 4.093 0.00% 0.00% 0.00% 0.95% 100.00% 4.194 0.00% 0.00% 0.00% 0.95% 100.00% 4.433 6.64 AAA 0.19 % TLH 3-7 Year Treasury IEF 7-10 Year Treasury 10-20 Year Treasury TLT 20+ Year Treasury AGZ 6.64 1.61% 0.40% 1.99% 1.9 6.64 AAA 0.76% 2.07% 1.27% 0.15% 4.56 3.12% 0.15% 99.96% 0.00% 5.31% 0.15% 99.21% 99.85% 0.00% 0.00% 0.00% 0.00% 0.00% 0.00% 0.00% 0.00% 0.00% 0.00% 0.00% 0.00% 0.00% 0.00% 0.00% 6.64 AAA 6.63 HYG 1-10 AGY MBB Mortgage-Backed Securities GNMA Govt National Mortgage Association CMBS Investment Grade Commercial MBS SHYG Shares 0-5 Year High Yield Corporate Bond IGSB Shares Short Term Corporate Bond Shares iBoxx $ High Yield Corporate Bond IGIB iShares Intermediate-Term Corporate Bond QLTA A-AAA Corporate Bond 6.62 9.28 9.28 9.29 5.39 5.39 LQD iShares iBoxx $ Investment Grade Corporate Bond 888 5.39 B 5.39 BBB 5.39 A 5.39 BBB 2.35% AAA 1.53% 2.79% AAA 0.56% 1.63% AAA 1.09% 3.77% AAA 0.99% 4.08% AAA 1.33% 3.30% 4.68% 6.20% 0.94% 3.28% 4.45% 5.85% 14.81 18.84 3.79 0.15% 98.53% 12.74% 0.15% 2.45% 0.20% 0.00% 0.00% 0.00% 0.00% 0.00% 0.00% 0.00% 0.00% 0.00% 0.00% 0.00% 0.00% 0.00% 0.00% 95.38% 0.00% 0.00% 2.03 2.22% 0.06% 146 2.29% 0.15% 0.00% 0.00% 0.00% 0.00% 0.00% 0.00% 0.00% 94.20% 5.80% 0.15% 100.00% 99.85% 0.00% 0.00% 0.00% 0.04% 100.00% 99.96% 0.00% 0.00% 0.00% 0.79% 100.00% 99.21% 0.00% 0.00% 0.00% 1.47% 100.00% 98.53% 0.00% 0.00% 0.00% 0.41% 100.00% 99.59% 0.00% 0.00% 0.00% 4.62% 100,00% 95.38% 100.00%|| 94.20% 0.00% 0.00% 0.00% 0.00% 0.15% 100.00% 5.000 0.00% 0.00% 0.00% 0.00% 0.04% 100.00% 5.000 0.00% 0.00% 0.00% 0.00% 0.00% 0.00% 0.00% 0.00% 0.00% 0.00% 0.00% 0.00% 0.00% 0.00% 0.00% 0.00% 0.00% 0.79% 100.00% 5.000 1.47% 100.00% 5.000 0.41% 100.00% 5.000 4.62% 100.00% 5.000 0.00% 5.80% 100.00% 5.000 0.00% 0.00% 0.00% 0.00% 5.01 1.78% 3.59% 1.56% 3.46% 2.09% 3.87% 3.83% 0.25% 7.51% 0.30% 2.75 3.33% 0.06% 3.39 8.41% 0.49% 6.41 6.79% 0.06% 8.36 5.35% 0.15% 9.63 7.45% 0.14% 0.00% 0.00% 0.00% 0.00% 0.00% 0.00% 0.00% 0.00% 74.74% 45.45% 0.00% 0.00% 73.62% 0.00% 0.00% 51.41% 0.00% 0.00% 47.57% 0.00% 0.00% 56.95% 40.00% 29.80% 0.00% 11.10% 13.45% 0.00% 41.32% 12.47% 0.00% 8.80% 14.16% 067% 34.03% 13.87% 0.00% 11.56% 0.00% 11.50% 0.00% 0.00% 0.00% 95.93% 4.07 % 99.63% 0.37% 100.00% 90.46% 0.71% 100.00% 0,75% 100,00% 0.81% 0.00% 2.75% 100.00% 0.00% 0.00% 0.69% 100.00% 0.62% 0.00% 0.87% 100.00% 3.37% 0.00% 1.75% 100.00% 2.05% 100.00% 95.93% 0.00% 0.00% 0.00% 0.00% 0.00% 0.00% 0.00% 4.07% 100.00% 5.000 6.76% 2.19% 0.22% 0.00% 0.00% 0.00% 0.00% 0.00% 0.00% 0.11% 51.87 % 33.10% 12.91 % 1.30% 7.41 % 42.19 % 48.84% 0.00% 0.00% 0.00% 0.00% 0.00% 0.00% 0.23% 54.74% 32.27% 10.62% 1.27% 5.35% 38.08% 55.26% 0.00% 0.00% 0.00% 0.00% 14.47 % 81.27% 0.02 % 0.00% 0.00% 0.00% 0.00% 7.60% 40.31% 48.40% 0.00% 0.00% 0.00% 0.00% 0.37% 100.00% 4.882 0.71% 100.00% 0.556 0.75% 100.00% 2.617 0.87% 100.00% 0.596 0.69% 100.00% 2.527 0.87% 100.00% 3.229 1.64% 100.00% 2.666 100.00 A 1.47% 3.28% 5.97 5.09% 0.17% 33.00% 6.31 % 18.85% 8.90% 4.15% 0.04% 26.90% 1.85% 100.00% 65.73% 2.51% 11.08% 8.25% 5.75% 3.52% 1.27% 0.14% 1.74% 100.00% 3.149 Description (As of 4/25/2024) Rows 8-22 need to be Updated with info from iShares.com Goal Higher Higher Higher Lower Lower Lower
Expert Answer:

Related Book For 

Posted Date:
Students also viewed these finance questions
-
Singapore is the second busiest container port in the world handling 37.5 million TEUs in 2021 with containerized cargo accounting for 60.7% of total cargo processed (Source: Maritime and Port...
-
started realizing there are things that I need to do that are more important than gangbanging and wasting my life in the streets. Even though I felt stuck in it. Even though there were 10 dudes that...
-
Managing Scope Changes Case Study Scope changes on a project can occur regardless of how well the project is planned or executed. Scope changes can be the result of something that was omitted during...
-
The management of a New York area investment firm wants to find out about the investment needs of its existing customers, for which it has an extensively detailed list, as a function of their...
-
Try to find a cooperative manager who will allow you to follow him or her around for a day. List the roles the manager plays and how much time he or she spends performing them.
-
The following facts pertain to a non-cancelable lease agreement between Alschuler Leasing and McKee Electronics, a lessee, for a computer system. Commencement date October 1, 2019 Lease...
-
Enrod Company has two divisions: Old and New. Its summary results are Enrods cost of capital is 16%. What is the ROI and RI for Old Division? a. 18%; $80,000 b. 20%; $100,000 c. 20%; $80,000 d. 18%;...
-
Coakwell Company worked on only two jobs during May. Information on the jobs is given below: At the beginning of the year, annual manufacturing overhead (MOH) was budgeted at $3,780,000 and Coakwell...
-
Help me figure out how to journalize the transactions and which journals each transaction takes place: Cash receipts journal Cash disbursements journal Purchase Journal Sales Journal General Ledger...
-
a. Find the linear approximating polynomial for the following function centered at the given point a. b. Find the quadratic approximating polynomial for the following function centered at the given...
-
Philco Chemicals makes a patented glue for gluing electronic components together. They have a CPU fan glue and a Moltherboard component glue. The glues use two patented chemical bonding agents called...
-
1.Iron Company reports the following information about its two divisions, Fabricating and Assembly.: Fabricating Division: Market price of the subassembly $50 Variable cost of the subassembly $20...
-
Problem 3 The Carlson Company is showing $14,724 in their Ledger Cash account on March 31, 20X3. As the company's Internal Auditor, you have been asked to do the reconcilation between the company...
-
a) Limited manufactures a single product, the budgeted selling price and variable cost details of which are as follows: Selling price Variable costs per unit: Direct materials Direct labour Variable...
-
Following data is extracted for the book of Durban Manufacturer. DEPARTMENT ADEPARTMENT B UNITS Started in process150, 000 Received from department A.95,000 Transferred to department B.95,000...
-
Zytel Corporation produces cleaning compounds and solutions for industrial and household use. While most of its products are processed independently, a few are related. Grit 337, a coarse cleaning...
-
Suppose you won a financial literacy competition and are given FJS10000 to invest, with the condition that investment can be done either in, i) Invest in Unit trust of Fiji or Invest in Fijian...
-
Sprague Company manufactures basketballs. Materials are added at the begin- ning of the production process and conversion costs are incurred uniformly. Production and cost data for the month of July...
-
(Target Costing) Driftwood Industries currently sells coffee tables for \($450\) each. It has costs per table of \($330.\) A new competitor is opening in the same mall as Driftwood and offers a...
-
Elite Company has several processing departments. Costs charged to the Assembly Department for November 2002 totaled $2,129,000 as follows. Production records show that 30,000 units were in beginning...

Study smarter with the SolutionInn App