Answered step by step
Verified Expert Solution
Link Copied!

Question

1 Approved Answer

1. Organize the following data. Use the best level of measurement to provide a summary for each variable/characteristic. a. Fill in the 2 bottom rows:
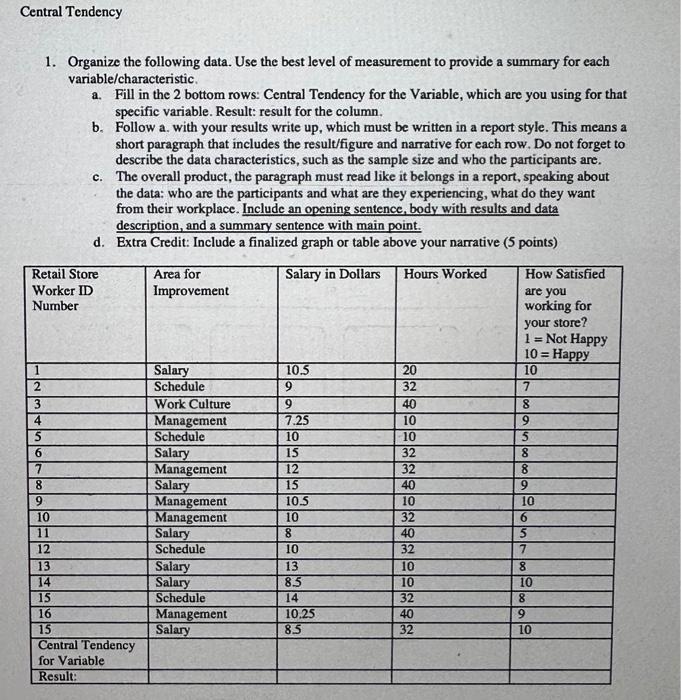
image text in transcribed
1. Organize the following data. Use the best level of measurement to provide a summary for each variable/characteristic. a. Fill in the 2 bottom rows: Central Tendency for the Variable, which are you using for that specific variable. Result: result for the column. b. Follow a. with your results write up, which must be written in a report style. This means a short paragraph that includes the result/figure and narrative for each row. Do not forget to describe the data characteristics, such as the sample size and who the participants are. c. The overall product, the paragraph must read like it belongs in a report, speaking about the data: who are the participants and what are they experiencing, what do they want from their workplace. Include an opening sentence, body with results and data description, and a summary sentence with main point. d. Extra Credit: Include a finalized graph or table above your narrative ( 5 points) 1. Organize the following data. Use the best level of measurement to provide a summary for each variable/characteristic. a. Fill in the 2 bottom rows: Central Tendency for the Variable, which are you using for that specific variable. Result: result for the column. b. Follow a. with your results write up, which must be written in a report style. This means a short paragraph that includes the result/figure and narrative for each row. Do not forget to describe the data characteristics, such as the sample size and who the participants are. c. The overall product, the paragraph must read like it belongs in a report, speaking about the data: who are the participants and what are they experiencing, what do they want from their workplace. Include an opening sentence, body with results and data description, and a summary sentence with main point. d. Extra Credit: Include a finalized graph or table above your narrative ( 5 points)

Step by Step Solution

There are 3 Steps involved in it

Step: 1

blur-text-image

Get Instant Access to Expert-Tailored Solutions

See step-by-step solutions with expert insights and AI powered tools for academic success

Step: 2

blur-text-image

Step: 3

blur-text-image

Ace Your Homework with AI

Get the answers you need in no time with our AI-driven, step-by-step assistance

Get Started

Recommended Textbook for

Simple Tools And Techniques For Enterprise Risk Management

Authors: Robert J. Chapman

1st Edition

1119989973, 978-1119989974

More Books

Students also viewed these Finance questions