Answered step by step
Verified Expert Solution
Question
1 Approved Answer
1. Parallax plays a part in measuring the internodal distances in Part 2. Describe in detail how measurements were made to minimize this effect.
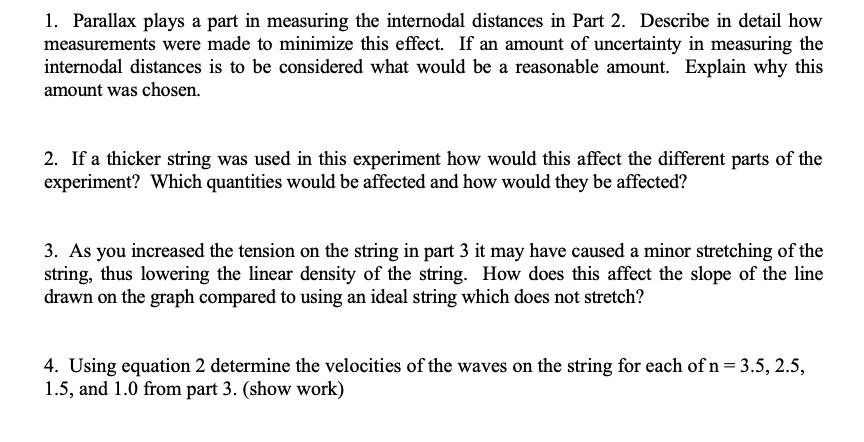

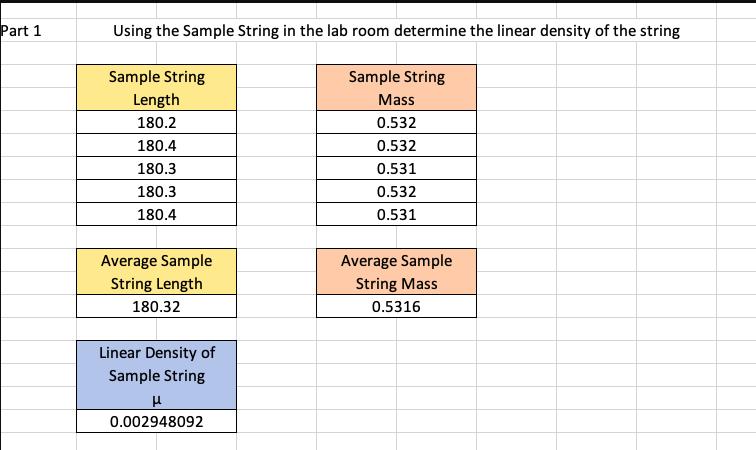
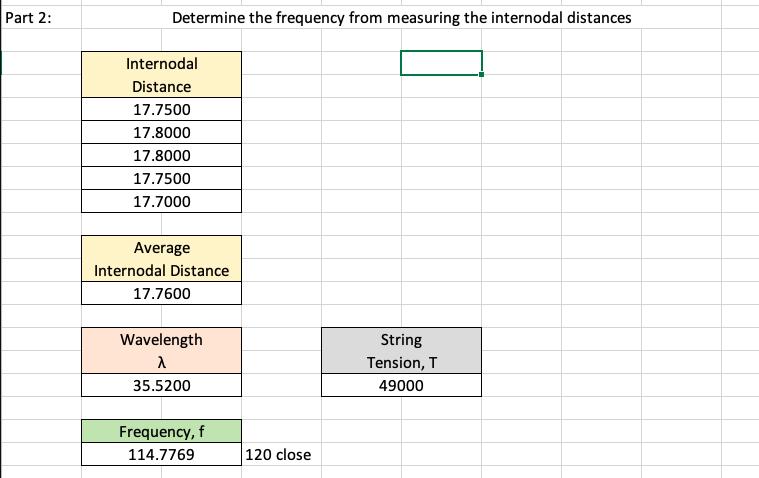
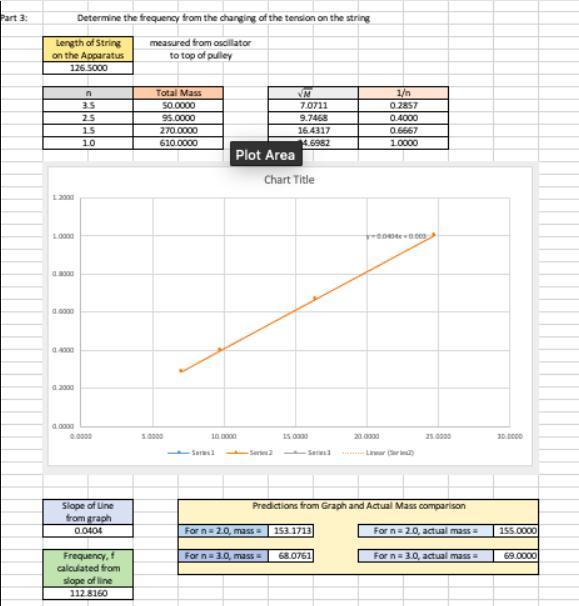
1. Parallax plays a part in measuring the internodal distances in Part 2. Describe in detail how measurements were made to minimize this effect. If an amount of uncertainty in measuring the internodal distances is to be considered what would be a reasonable amount. Explain why this amount was chosen. 2. If a thicker string was used in this experiment how would this affect the different parts of the experiment? Which quantities would be affected and how would they be affected? 3. As you increased the tension on the string in part 3 it may have caused a minor stretching of the string, thus lowering the linear density of the string. How does this affect the slope of the line drawn on the graph compared to using an ideal string which does not stretch? 4. Using equation 2 determine the velocities of the waves on the string for each of n = 3.5, 2.5, 1.5, and 1.0 from part 3. (show work) f =v (2) Part 1 Using the Sample String in the lab room determine the linear density of the string Sample String Sample String Length Mass 180.2 0.532 180.4 0.532 180.3 0.531 180.3 0.532 180.4 0.531 Average Sample String Length 180.32 Linear Density of Sample String 0.002948092 Average Sample String Mass 0.5316 Part 2: Determine the frequency from measuring the internodal distances Internodal Distance 17.7500 17.8000 17.8000 17.7500 17.7000 Average Internodal Distance 17.7600 Wavelength 35.5200 Frequency, f 114.7769 120 close String Tension, T 49000 Part 3: Determine the frequency from the changing of the tension on the string Length of String on the Apparatus measured from oscillator to top of pulley 126.5000 1.0000 09000 0.0000 0.2000 0.0000 n 3.5 2.5 15 10 0.0000 Slope of Line from graph 0.0404 Frequency, f calculated from slope of line 112.8160 Total Mass 50.0000 95.0000 270.0000 610.0000 Plot Area 100000 For n=2.0, mass M 7.0711 9.7468 16.4317 4.6982 For n= 3.0, mass= Chart Title 15:0030 -Served 153.1713 Predictions from Graph and Actual Mass comparison 68.0761 1/n 0.2857 0.4000 0.6667 1.0000 1-0000-0000 210330 25.0000 For n=2.0, actual mass= For n = 3.0, actual mass 30.0000 155.0000 69.0000
Step by Step Solution
There are 3 Steps involved in it
Step: 1
It looks like youre conducting a physics experiment related to waves on a string and youve provided some data and questions related to the experiment Lets go through each of your questions one by one ...
Get Instant Access to Expert-Tailored Solutions
See step-by-step solutions with expert insights and AI powered tools for academic success
Step: 2

Step: 3

Ace Your Homework with AI
Get the answers you need in no time with our AI-driven, step-by-step assistance
Get Started


