

Answered step by step
Verified Expert Solution
Question
1 Approved Answer
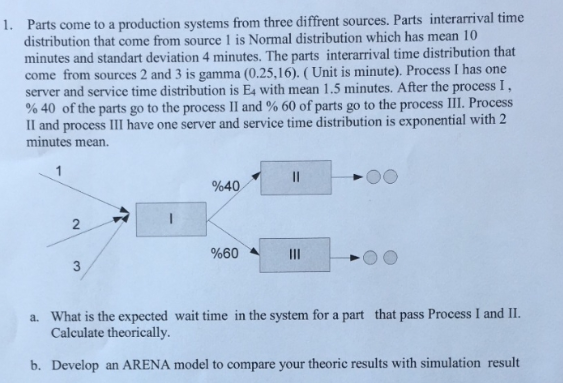
1. Parts come to a production systems from three diffrent sources. Parts interarrival time distribution that come from source 1 is Normal distribution which has
Step by Step Solution
There are 3 Steps involved in it
Step: 1

Get Instant Access to Expert-Tailored Solutions
See step-by-step solutions with expert insights and AI powered tools for academic success
Step: 2

Step: 3
Ace Your Homework with AI
Get the answers you need in no time with our AI-driven, step-by-step assistance
Get Started
Internal Audit Of Treasury And Cash Management
Authors: Badr Bentalha
1st Edition
B0BM3R6WG7, 979-8363213779