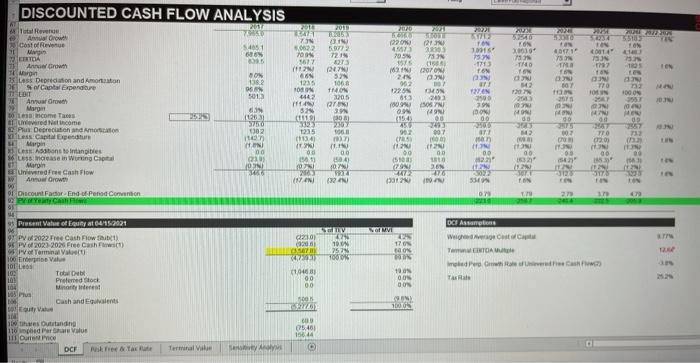
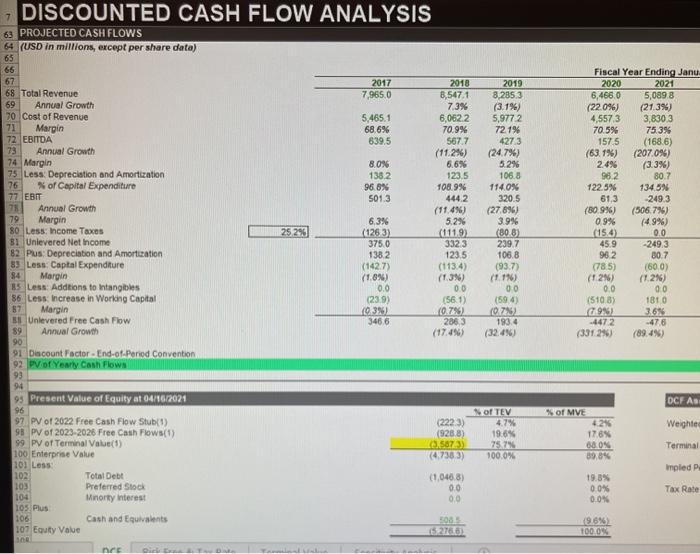
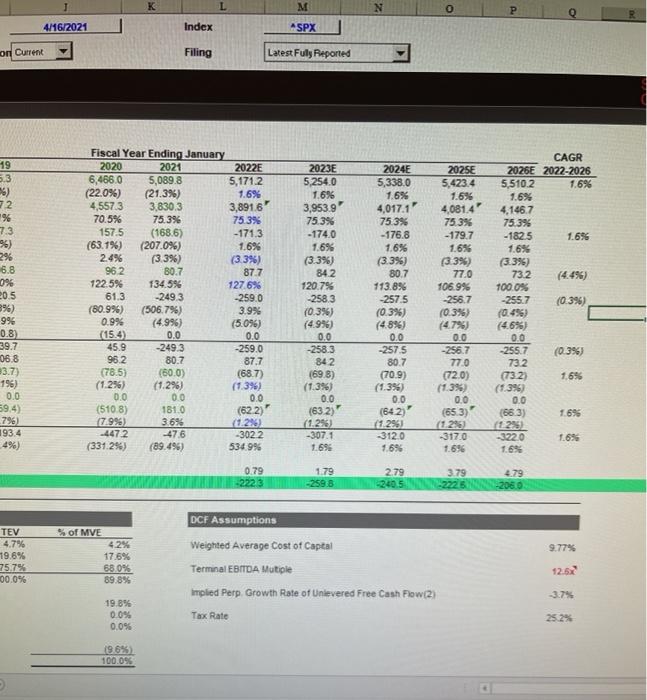
1. please analyze why the implied per share is negative on the DCF analysis.
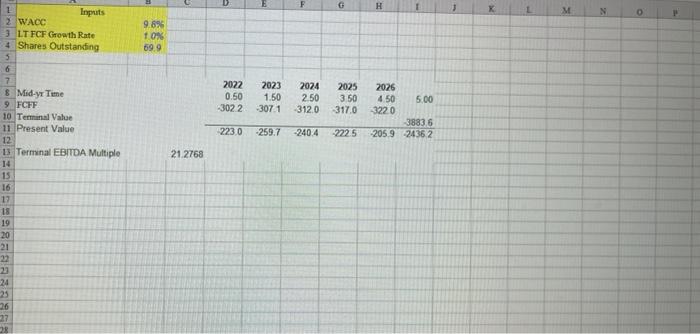
2. attempted to find the implied per share value on the second slide. please compare the difference.
3. in a couple sentences, please compare the difference of calculayinh pv of terminal value through time value of money vs terminal EBITDA mulitiple
DISCOUNTED CASH FLOW ANALYSIS 2017 2011 21 2 La NEX IND THAM INI CE NES TON 55103 TON S4851 688 . 72.19 KON 20010 73 GOT 7 NE FIDO MECE 75 -1773 TON TO 77 WE SOL 50022 00 5677 (12 12:35 08 4442 INCO NO INCO 80 1382 06 5013 IND 12 5 1068 1140 2205 ar NE INCO N: 507 To N NO 23 200 NO PER CO INROSE ING 20 200 23:01 4 705 15 15 12120ON 962 1225 813 09 09 194 450 23 902 001 CS ( 00 BEN 276 Da 100 ON 3551 LAD IN Total Revende Arrow Cost of Revenge M VERTA Anwth TEM Sites Depreciation and Aston 16 Captal Expendare TUDIT Ana Orowth Margu De comes red income SP Depreciation Am Les Capital pendu Mwin Abons to Intangibles increase in Wung Capital Margin und Free Cash Flow Ano Orow O Discount Factor End--Pened Coton NO NO ME NE NOG 00 IND INN 56 HON 8 (11191 0 90 133 63 (12031 3750 30 Ion MON 00 1235 90 CC CH 007 03 TO 02.0 90 NH 00 00 INCU 00 . IN 00 TO INCOR IN 00 (2015) IN 00 ON 23 (WIN on INO . COS MPS . NO OS IN2 TON ME 00 16 Q210 (920 ANS NT 10 757 1000 VW 0 170 an DC Assamos Weigel TETOA moderne Tas Rate Present Value of our 64/12021 9 P 2022 Cath Flow 95 PV of 2027 2026 Free Cash) 93 PV of Tarminal 100 EV 10 L 103 To 101 Prieme do 104 Minions Pus Cash and Events Logo 10 standing 110 cedera 111 De DCF Nekretar 14701 (1046 00 00 SO NE DON ON 500 AN) WE 05.461 15814 Terminal SA H 3 L M N O P 1 Inputs 2 WACC 3 LTFCF Growth Rate 4 Shares Outstanding 5 9.8% 10% 699 2022 0.50 2023 1.50 -3071 2074 250 -3120 2025 3.50 317.0 -3022 2026 4.50 5.00 13220 38836 205.9 24362 2230 -259.7 -2404 2225 21.2768 7 8 Mid-y Time 9 FCFF 10 Terminal Value 11 Present Value 12 13 Terminal EBITDA Multiple 14 15 16 17 18 19 20 21 22 23 24 25 26 DISCOUNTED CASH FLOW ANALYSIS 7 63 PROJECTED CASH FLOWS 64 (USD in millions, except per share data) 65 66 67 2017 2018 68 Total Revenue 7,965.0 8,547.1 69 Annual Growth 7.3% 70 Cost of Revenue 5,465.1 6,0622 71 Margin 68.6% 70.9% 72 EBITDA 639.5 567.7 73 Annual Growth (11.2%) 74 Margin 8.0% 6.6% 75 Less Depreciation and Amortization 138.2 123.5 76 % of Capital Expenditure 96.8% 108.9% 77. EBIT 5013 444.2 78 Annual Growth (11.4) 79 Margin 6.3% 5.2% 80 Less: Income Taxes 25 296 (1263) (111.92 B1 Unlevered Net Income 3750 3323 82. Pus: Depreciation and Amortization 138.2 123.5 83 Less: Captal Expenditure (142.7) (113.4) 84 Margin (1.8%) (1.3%) 85 Less: Additions to intangibles 0.0 00 86 Less increase in Working Capital (239) (561) 57 Margin (93%) 0.7%) B Unlevered Free Cash Flow 3466 286,3 89 Annual Growth (17.4%) 90 91 Discount Factor-End-of. Period Convention 92 PV of Yearly Cash Flows 93 94 Present Value of Equity at 04/16/2021 96 97 PV of 2022 Free Cash Flow Stub(1) (2223) 95 PV of 2023 2026 Free Cash Flows() (9288) 99 PV of Terminal Value(1) 2.5873 100 Enterprise Value (4.7383) 101 Loss Total Debt (1.040.8) 103 Preferred Stock 00 104 Minorty interest 00 105 Plus 106 Cash and Equivalents 107 Equity Value 152700 an net 2019 8,285.3 (3.1%) 5,9772 721% 4273 (24.7%) 5.2% 106.8 114.0% 320.5 (27.696) 3.9% (808) 239.7 106.8 (93.7) (1.1) 00 (594) 0752 193.4 (32.4%) Fiscal Year Ending Janu 2020 2021 6,466.0 5,0898 (22.0%) (2139) 4,5573 3,8303 70.5% 75.3% 1575 (1686) (63.1%) (207.0%) 24% (3.3%) 962 80.7 122.5% 13459 61,3 249.3 (80.9%) (506.7%) 09% (4.9%) (150) 0.0 45.9 -2493 962 80.7 (785) (600) (1246) (1.2%) 0.0 00 (5108) 1810 C19%) 3.6 -4472 -476 (331.29) (89.4%) DCF AS Weighted of TEV 4.7% 19.6% 75.7% 100.0% of MVE 4.2% 17.6% 08.0% 89.8% Terminal impled P. 102 19.5% 0.0% 0.0% Tax Rate LOG 19.6% 100.0% M N o P 4/6/2021 Index ASPX on Current Filing Latest Fully Reported 19 5.3 ) 72 % 7.3 96) 2% 6.8 962 0% Fiscal Year Ending January 2020 2021 6,466.0 5,089.8 (22.0%) (21.3%) 4,5573 3,830.3 70.5% 75.3% 157.5 (1686) (63.1%) (207.0%) 2.4% (3.3%) 80.7 122.5% 134.5% 61.3 -2493 (80.9%) (506.7%) 0.9% (4.9%) (15.4) 0.0 45.9 -249.3 96.2 80.7 (78.5) (600) (1.2%) (1.2%) 0.0 0.0 (5108) 181.0 (7.9%) 3.6% -4472 -476 (331.2%) (89.496) 2022E 5,171.2 1.6% 3,8916 75.3% -171.3 1.6% (3.3%) 87.7 127.6% -259.0 3.9% (5.096) 0.0 -259.0 87.7 (68.7) (1.3%) 0.0 (622) (1.29 -3022 534.9% 2023E 5,254.0 1.6% 3,953.9' 75.3% -174.0 1.6% (3.3%) 842 120.7% -258.3 (0.3%) (4.9%) 0.0 -258.3 842 (698) (1.3%) CAGR 2026E 2022-2026 5.510.2 1.6% 1.6% 4,146.7 75.3% -1825 1.656 1.6% (3.3%) 73.2 100.0% -255.7 (0.3%) (0.4%) (4.6%) 20.5 39) 996 0.8) 39.7 06.8 3.7) 196) 0.0 59.4) 796) 1934 4%) 2024E 5,338.0 1.6% 4,017.1 75.3% -176.8 1.6% (3.3%) 80.7 113.8% -2575 (0.3%) (4.8% 0.0 -2575 80.7 (70.9) (1.396) 0.0 (642) 1.295) -3120 1.69 2025E 5,423.4 1.6% 4,081.4 75.3% -179.7 1.6% (3.3%) 77.0 106.9% -256.7 (0.3%) (4.7%) 0.0 -256.7 77.0 (720) (1.3% 0.0 (653) (1.2% -3170 1.6% (0.396) 1.6% 0.0 255.7 732 (732) (1.3%) 0.0 (663) (125) 220 1.6% 1.695 (632) (1.29) -3071 1.696 1.6% 0.79 -2223 1.79 -258.8 2.79 3.79 -2225 4.79 -2060 DCF Assumptions Weighted Average Cost of Captal 9.779 TEV 4.7% 19.6% 75.7% 00.0% % of MVE 4.2% 17.6% 68.0% 89.8% 12.62 Terminal EBITDA Mutiple implied Perp, Growth Rate of Unlevered Free Cash Flow(2) -3.7% 19.8% 0.0% 0.0% Tax Rate 25.2% 1969) 100.096 DISCOUNTED CASH FLOW ANALYSIS 2017 2011 21 2 La NEX IND THAM INI CE NES TON 55103 TON S4851 688 . 72.19 KON 20010 73 GOT 7 NE FIDO MECE 75 -1773 TON TO 77 WE SOL 50022 00 5677 (12 12:35 08 4442 INCO NO INCO 80 1382 06 5013 IND 12 5 1068 1140 2205 ar NE INCO N: 507 To N NO 23 200 NO PER CO INROSE ING 20 200 23:01 4 705 15 15 12120ON 962 1225 813 09 09 194 450 23 902 001 CS ( 00 BEN 276 Da 100 ON 3551 LAD IN Total Revende Arrow Cost of Revenge M VERTA Anwth TEM Sites Depreciation and Aston 16 Captal Expendare TUDIT Ana Orowth Margu De comes red income SP Depreciation Am Les Capital pendu Mwin Abons to Intangibles increase in Wung Capital Margin und Free Cash Flow Ano Orow O Discount Factor End--Pened Coton NO NO ME NE NOG 00 IND INN 56 HON 8 (11191 0 90 133 63 (12031 3750 30 Ion MON 00 1235 90 CC CH 007 03 TO 02.0 90 NH 00 00 INCU 00 . IN 00 TO INCOR IN 00 (2015) IN 00 ON 23 (WIN on INO . COS MPS . NO OS IN2 TON ME 00 16 Q210 (920 ANS NT 10 757 1000 VW 0 170 an DC Assamos Weigel TETOA moderne Tas Rate Present Value of our 64/12021 9 P 2022 Cath Flow 95 PV of 2027 2026 Free Cash) 93 PV of Tarminal 100 EV 10 L 103 To 101 Prieme do 104 Minions Pus Cash and Events Logo 10 standing 110 cedera 111 De DCF Nekretar 14701 (1046 00 00 SO NE DON ON 500 AN) WE 05.461 15814 Terminal SA H 3 L M N O P 1 Inputs 2 WACC 3 LTFCF Growth Rate 4 Shares Outstanding 5 9.8% 10% 699 2022 0.50 2023 1.50 -3071 2074 250 -3120 2025 3.50 317.0 -3022 2026 4.50 5.00 13220 38836 205.9 24362 2230 -259.7 -2404 2225 21.2768 7 8 Mid-y Time 9 FCFF 10 Terminal Value 11 Present Value 12 13 Terminal EBITDA Multiple 14 15 16 17 18 19 20 21 22 23 24 25 26 DISCOUNTED CASH FLOW ANALYSIS 7 63 PROJECTED CASH FLOWS 64 (USD in millions, except per share data) 65 66 67 2017 2018 68 Total Revenue 7,965.0 8,547.1 69 Annual Growth 7.3% 70 Cost of Revenue 5,465.1 6,0622 71 Margin 68.6% 70.9% 72 EBITDA 639.5 567.7 73 Annual Growth (11.2%) 74 Margin 8.0% 6.6% 75 Less Depreciation and Amortization 138.2 123.5 76 % of Capital Expenditure 96.8% 108.9% 77. EBIT 5013 444.2 78 Annual Growth (11.4) 79 Margin 6.3% 5.2% 80 Less: Income Taxes 25 296 (1263) (111.92 B1 Unlevered Net Income 3750 3323 82. Pus: Depreciation and Amortization 138.2 123.5 83 Less: Captal Expenditure (142.7) (113.4) 84 Margin (1.8%) (1.3%) 85 Less: Additions to intangibles 0.0 00 86 Less increase in Working Capital (239) (561) 57 Margin (93%) 0.7%) B Unlevered Free Cash Flow 3466 286,3 89 Annual Growth (17.4%) 90 91 Discount Factor-End-of. Period Convention 92 PV of Yearly Cash Flows 93 94 Present Value of Equity at 04/16/2021 96 97 PV of 2022 Free Cash Flow Stub(1) (2223) 95 PV of 2023 2026 Free Cash Flows() (9288) 99 PV of Terminal Value(1) 2.5873 100 Enterprise Value (4.7383) 101 Loss Total Debt (1.040.8) 103 Preferred Stock 00 104 Minorty interest 00 105 Plus 106 Cash and Equivalents 107 Equity Value 152700 an net 2019 8,285.3 (3.1%) 5,9772 721% 4273 (24.7%) 5.2% 106.8 114.0% 320.5 (27.696) 3.9% (808) 239.7 106.8 (93.7) (1.1) 00 (594) 0752 193.4 (32.4%) Fiscal Year Ending Janu 2020 2021 6,466.0 5,0898 (22.0%) (2139) 4,5573 3,8303 70.5% 75.3% 1575 (1686) (63.1%) (207.0%) 24% (3.3%) 962 80.7 122.5% 13459 61,3 249.3 (80.9%) (506.7%) 09% (4.9%) (150) 0.0 45.9 -2493 962 80.7 (785) (600) (1246) (1.2%) 0.0 00 (5108) 1810 C19%) 3.6 -4472 -476 (331.29) (89.4%) DCF AS Weighted of TEV 4.7% 19.6% 75.7% 100.0% of MVE 4.2% 17.6% 08.0% 89.8% Terminal impled P. 102 19.5% 0.0% 0.0% Tax Rate LOG 19.6% 100.0% M N o P 4/6/2021 Index ASPX on Current Filing Latest Fully Reported 19 5.3 ) 72 % 7.3 96) 2% 6.8 962 0% Fiscal Year Ending January 2020 2021 6,466.0 5,089.8 (22.0%) (21.3%) 4,5573 3,830.3 70.5% 75.3% 157.5 (1686) (63.1%) (207.0%) 2.4% (3.3%) 80.7 122.5% 134.5% 61.3 -2493 (80.9%) (506.7%) 0.9% (4.9%) (15.4) 0.0 45.9 -249.3 96.2 80.7 (78.5) (600) (1.2%) (1.2%) 0.0 0.0 (5108) 181.0 (7.9%) 3.6% -4472 -476 (331.2%) (89.496) 2022E 5,171.2 1.6% 3,8916 75.3% -171.3 1.6% (3.3%) 87.7 127.6% -259.0 3.9% (5.096) 0.0 -259.0 87.7 (68.7) (1.3%) 0.0 (622) (1.29 -3022 534.9% 2023E 5,254.0 1.6% 3,953.9' 75.3% -174.0 1.6% (3.3%) 842 120.7% -258.3 (0.3%) (4.9%) 0.0 -258.3 842 (698) (1.3%) CAGR 2026E 2022-2026 5.510.2 1.6% 1.6% 4,146.7 75.3% -1825 1.656 1.6% (3.3%) 73.2 100.0% -255.7 (0.3%) (0.4%) (4.6%) 20.5 39) 996 0.8) 39.7 06.8 3.7) 196) 0.0 59.4) 796) 1934 4%) 2024E 5,338.0 1.6% 4,017.1 75.3% -176.8 1.6% (3.3%) 80.7 113.8% -2575 (0.3%) (4.8% 0.0 -2575 80.7 (70.9) (1.396) 0.0 (642) 1.295) -3120 1.69 2025E 5,423.4 1.6% 4,081.4 75.3% -179.7 1.6% (3.3%) 77.0 106.9% -256.7 (0.3%) (4.7%) 0.0 -256.7 77.0 (720) (1.3% 0.0 (653) (1.2% -3170 1.6% (0.396) 1.6% 0.0 255.7 732 (732) (1.3%) 0.0 (663) (125) 220 1.6% 1.695 (632) (1.29) -3071 1.696 1.6% 0.79 -2223 1.79 -258.8 2.79 3.79 -2225 4.79 -2060 DCF Assumptions Weighted Average Cost of Captal 9.779 TEV 4.7% 19.6% 75.7% 00.0% % of MVE 4.2% 17.6% 68.0% 89.8% 12.62 Terminal EBITDA Mutiple implied Perp, Growth Rate of Unlevered Free Cash Flow(2) -3.7% 19.8% 0.0% 0.0% Tax Rate 25.2% 1969) 100.096
