

Question
1. Please calculate the following two ratios on the firm's payout policy and illustrate these time series in a bar figure. - Repurchase ratio: purchase
1. Please calculate the following two ratios on the firm's payout policy and illustrate these time series in a bar figure.
- Repurchase ratio: purchase of stock / total assets
- Dividend ratio: dividend / total assets
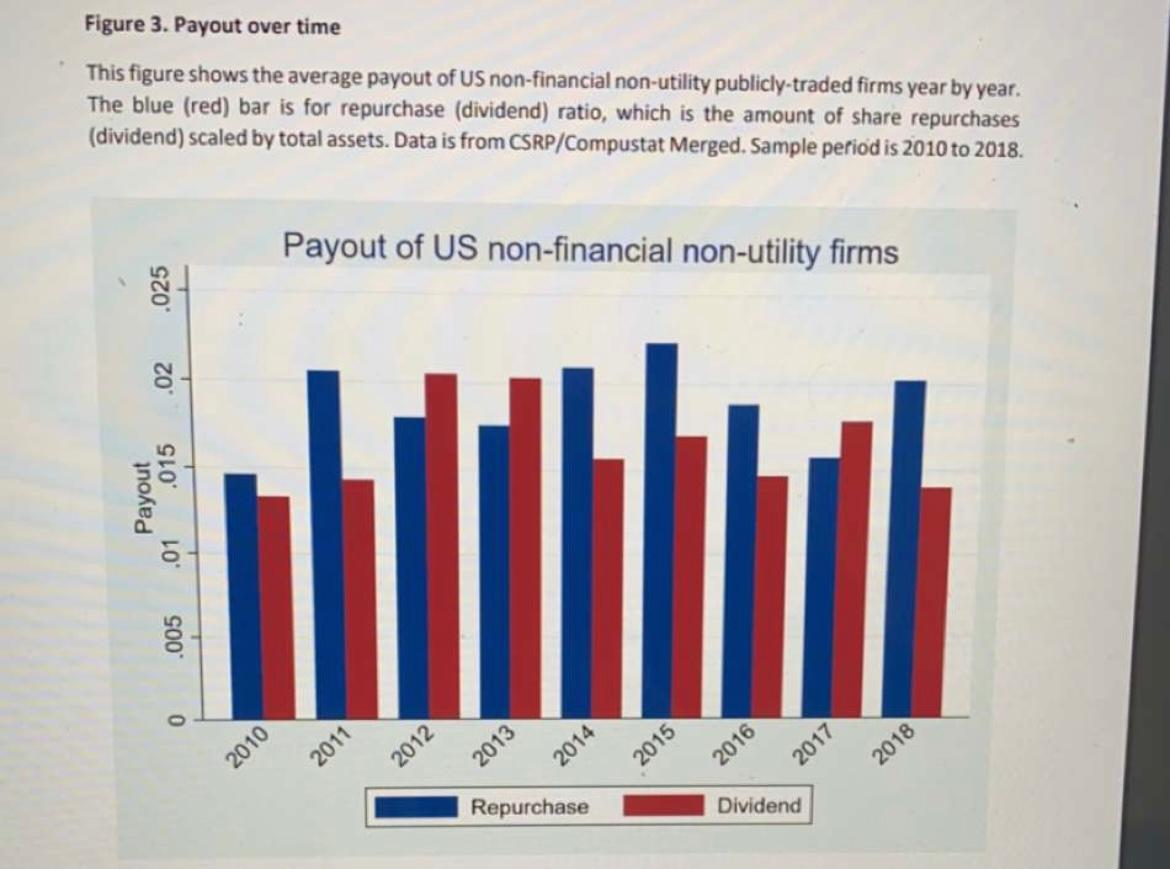
Do you observe any pattern in thsi figure? For example, which is larger and is share repurchase more or less stable than dividend? Link the characteristics of this firm and the theory of payout policy to comment on the pattern you observe. Please see figure 3 for an average US firm's payout. The number of words should be no greater than 500. (5 marks)
2. Please calculate the yearly repurchase to total payout ratio and plot the time series in a bar figure.
- Repurchase to total payout ratio: purchase of stock / (purchase of stock + dividend)
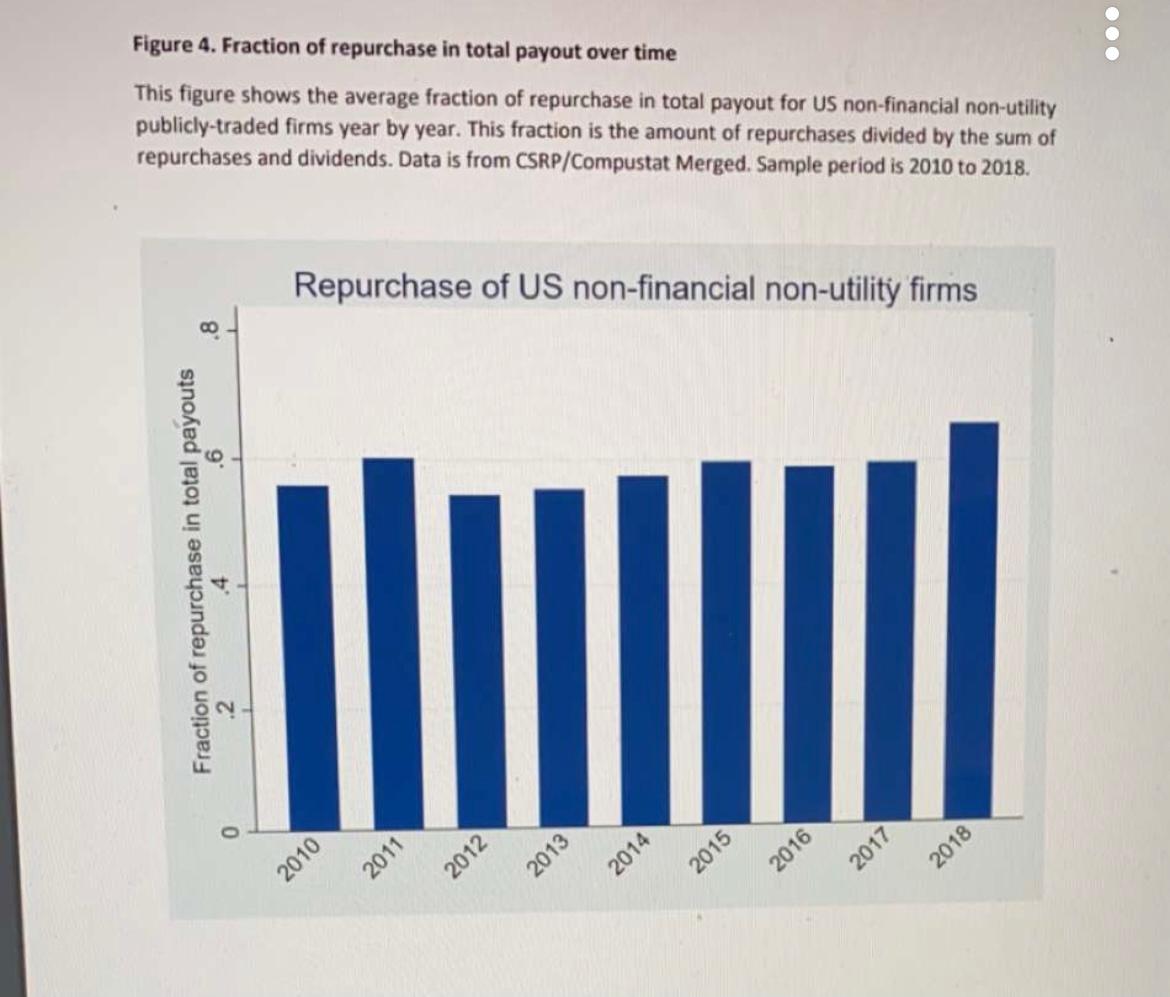
Do you observe any patterns in this figure? for example, has repurchase become relatively more or less important? Link the characteristics of this firm and the theory of payout policy to comment on the pattern you observe. Please see figure 4 for an average US firm's repurchase to total payout ratio. 500 words max. (5 marks)
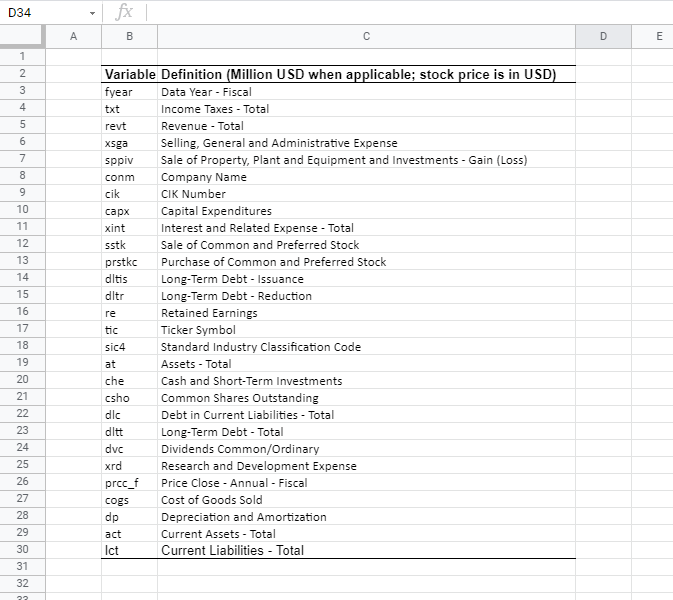
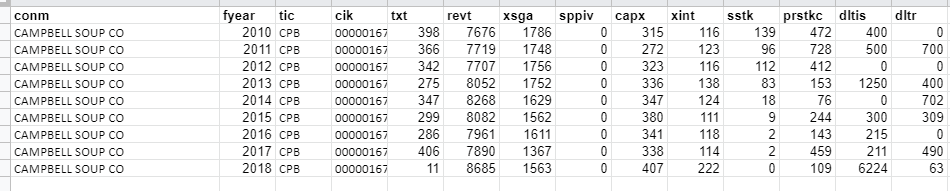
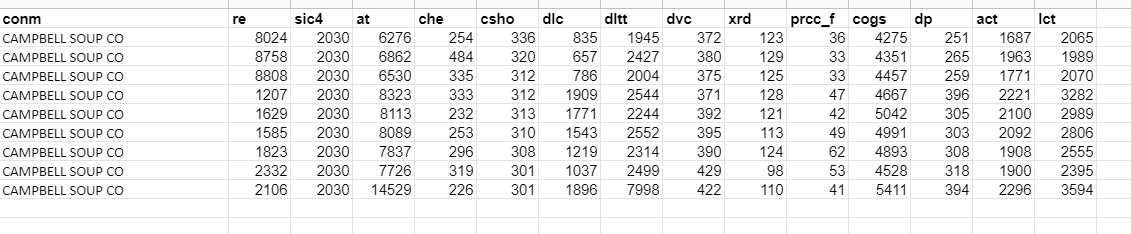
D34 A B D E 1 2 3 4 5 6 7 8 Variable Definition (Million USD when applicable; stock price is in USD) fyear Data Year - Fiscal txt Income Taxes - Total revt Revenue - Total xsga Selling, General and Administrative Expense sppiv Sale of Property, Plant and Equipment and Investments - Gain (Loss) conm Company Name cik CIK Number Capital Expenditures xint Interest and Related Expense - Total sstk Sale of Common and Preferred Stock prstkc Purchase of common and Preferred Stock ditis Long-Term Debt - Issuance ditr Long-Term Debt - Reduction re Retained Earnings tic Ticker Symbol sic4 Standard Industry Classification Code Assets - Total che Cash and Short-Term Investments csho Common Shares Outstanding Debt in Current Liabilities - Total ditt Long-Term Debt - Total dvc Dividends Common/Ordinary xrd Research and Development Expense prcc_f Price Close - Annual - Fiscal cogs Cost of Goods Sold dp Depreciation and Amortization act Current Assets - Total Ict Current Liabilities - Total 9 10 11 12 13 14 15 16 17 18 19 20 21 22 23 24 25 26 27 28 29 30 31 32 at dlc 29 conm CAMPBELL SOUP CO CAMPBELL SOUP CO CAMPBELL SOUP CO CAMPBELL SOUP CO CAMPBELL SOUP CO CAMPBELL SOUP CO CAMPBELL SOUP CO CAMPBELL SOUP CO CAMPBELL SOUP CO fyear tic 2010 CPB 2011 CPB 2012 CPB 2013 CPB 2014 CPB 2015 CPB 2016 CPB 2017 CPB 2018 CPB cik txt 00000167 00000167 00000167 00000167 00000167 00000167 00000167 00000167 00000167 revt 398 7676 366 7719 342 7707 275 8052 347 8268 299 8082 286 7961 406 7890 11 8685 xsga sppiv 1786 1748 1756 1752 1629 1562 1611 1367 1563 OOOOOOOOO capx 315 272 323 336 347 380 341 338 407 xint 116 123 116 138 124 111 118 114 222 sstk prstkc 139 472 96 728 112 412 83 153 18 76 9 244 143 459 109 ditis ditr 400 0 500 700 0 0 1250 400 702 300 309 215 0 211 490 6224 63 ONN CO 4351 conm CAMPBELL SOUP CO CAMPBELL SOUP CO CAMPBELL SOUP CO CAMPBELL SOUP CO CAMPBELL SOUP CO CAMPBELL SOUP CO CAMPBELL SOUP CO CAMPBELL SOUP CO CAMPBELL SOUP CO re sic4 at che csho dlc ditt dvc xrd prcc_f cogs dp 8024 2030 6276 254 336 835 1945 372 123 36 4275 8758 2030 6862 484 320 657 2427 380 129 33 8808 2030 6530 335 312 786 2004 375 125 33 4457 1207 2030 8323 333 312 1909 2544 371 128 47 4667 1629 2030 8113 232 313 1771 2244 392 121 42 5042 1585 2030 8089 253 310 1543 2552 395 113 49 4991 1823 2030 7837 296 308 1219 2314 390 124 62 4893 2332 2030 7726 319 301 1037 2499 429 98 53 4528 2106 2030 14529 226 301 1896 7998 422 110 41 5411 act Ict 251 1687 2065 265 1963 1989 259 1771 2070 396 2221 3282 305 2100 2989 303 2092 2806 308 1908 2555 318 1900 2395 394 2296 3594 Figure 3. Payout over time This figure shows the average payout of US non-financial non-utility publicly-traded firms year by year. The blue (red) bar is for repurchase (dividend) ratio, which is the amount of share repurchases (dividend) scaled by total assets. Data is from CSRP/Compustat Merged. Sample period is 2010 to 2018. Payout of US non-financial non-utility firms .025 .02 .015 Payout .01 .005 0 2011 2013 2014 2017 2010 2012 2015 2016 2018 Repurchase Dividend Figure 4. Fraction of repurchase in total payout over time This figure shows the average fraction of repurchase in total payout for US non-financial non-utility publicly-traded firms year by year. This fraction is the amount of repurchases divided by the sum of repurchases and dividends. Data is from CSRP/Compustat Merged. Sample period is 2010 to 2018. Repurchase of US non-financial non-utility firms 8 .6 Fraction of repurchase in total payouts 0 2010 2011 2013 2014 2015 2016 2017 2018 2012 D34 A B D E 1 2 3 4 5 6 7 8 Variable Definition (Million USD when applicable; stock price is in USD) fyear Data Year - Fiscal txt Income Taxes - Total revt Revenue - Total xsga Selling, General and Administrative Expense sppiv Sale of Property, Plant and Equipment and Investments - Gain (Loss) conm Company Name cik CIK Number Capital Expenditures xint Interest and Related Expense - Total sstk Sale of Common and Preferred Stock prstkc Purchase of common and Preferred Stock ditis Long-Term Debt - Issuance ditr Long-Term Debt - Reduction re Retained Earnings tic Ticker Symbol sic4 Standard Industry Classification Code Assets - Total che Cash and Short-Term Investments csho Common Shares Outstanding Debt in Current Liabilities - Total ditt Long-Term Debt - Total dvc Dividends Common/Ordinary xrd Research and Development Expense prcc_f Price Close - Annual - Fiscal cogs Cost of Goods Sold dp Depreciation and Amortization act Current Assets - Total Ict Current Liabilities - Total 9 10 11 12 13 14 15 16 17 18 19 20 21 22 23 24 25 26 27 28 29 30 31 32 at dlc 29 conm CAMPBELL SOUP CO CAMPBELL SOUP CO CAMPBELL SOUP CO CAMPBELL SOUP CO CAMPBELL SOUP CO CAMPBELL SOUP CO CAMPBELL SOUP CO CAMPBELL SOUP CO CAMPBELL SOUP CO fyear tic 2010 CPB 2011 CPB 2012 CPB 2013 CPB 2014 CPB 2015 CPB 2016 CPB 2017 CPB 2018 CPB cik txt 00000167 00000167 00000167 00000167 00000167 00000167 00000167 00000167 00000167 revt 398 7676 366 7719 342 7707 275 8052 347 8268 299 8082 286 7961 406 7890 11 8685 xsga sppiv 1786 1748 1756 1752 1629 1562 1611 1367 1563 OOOOOOOOO capx 315 272 323 336 347 380 341 338 407 xint 116 123 116 138 124 111 118 114 222 sstk prstkc 139 472 96 728 112 412 83 153 18 76 9 244 143 459 109 ditis ditr 400 0 500 700 0 0 1250 400 702 300 309 215 0 211 490 6224 63 ONN CO 4351 conm CAMPBELL SOUP CO CAMPBELL SOUP CO CAMPBELL SOUP CO CAMPBELL SOUP CO CAMPBELL SOUP CO CAMPBELL SOUP CO CAMPBELL SOUP CO CAMPBELL SOUP CO CAMPBELL SOUP CO re sic4 at che csho dlc ditt dvc xrd prcc_f cogs dp 8024 2030 6276 254 336 835 1945 372 123 36 4275 8758 2030 6862 484 320 657 2427 380 129 33 8808 2030 6530 335 312 786 2004 375 125 33 4457 1207 2030 8323 333 312 1909 2544 371 128 47 4667 1629 2030 8113 232 313 1771 2244 392 121 42 5042 1585 2030 8089 253 310 1543 2552 395 113 49 4991 1823 2030 7837 296 308 1219 2314 390 124 62 4893 2332 2030 7726 319 301 1037 2499 429 98 53 4528 2106 2030 14529 226 301 1896 7998 422 110 41 5411 act Ict 251 1687 2065 265 1963 1989 259 1771 2070 396 2221 3282 305 2100 2989 303 2092 2806 308 1908 2555 318 1900 2395 394 2296 3594 Figure 3. Payout over time This figure shows the average payout of US non-financial non-utility publicly-traded firms year by year. The blue (red) bar is for repurchase (dividend) ratio, which is the amount of share repurchases (dividend) scaled by total assets. Data is from CSRP/Compustat Merged. Sample period is 2010 to 2018. Payout of US non-financial non-utility firms .025 .02 .015 Payout .01 .005 0 2011 2013 2014 2017 2010 2012 2015 2016 2018 Repurchase Dividend Figure 4. Fraction of repurchase in total payout over time This figure shows the average fraction of repurchase in total payout for US non-financial non-utility publicly-traded firms year by year. This fraction is the amount of repurchases divided by the sum of repurchases and dividends. Data is from CSRP/Compustat Merged. Sample period is 2010 to 2018. Repurchase of US non-financial non-utility firms 8 .6 Fraction of repurchase in total payouts 0 2010 2011 2013 2014 2015 2016 2017 2018 2012Step by Step Solution
There are 3 Steps involved in it
Step: 1

Get Instant Access to Expert-Tailored Solutions
See step-by-step solutions with expert insights and AI powered tools for academic success
Step: 2

Step: 3
Ace Your Homework with AI
Get the answers you need in no time with our AI-driven, step-by-step assistance
Get Started
Money Talks Explaining How Money Really Works
Authors: Nina Bandelj ,Frederick F. Wherry ,Viviana A. Zelizer
1st Edition
0691202893, 978-0691202891