Question
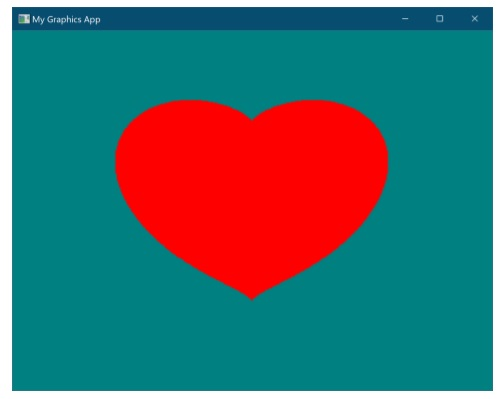
1. Plot the contour of the function = (2 + 2 1)3 2 3 using GL_POINTS. You will need to write the code in myDisplay
1. Plot the contour of the function = (2 + 2 1)3 2 3 using GL_POINTS. You will need to write the code in myDisplay function. Remember that the screen size is width = 640 and height = 480.
a. Using a nested loop for [2.0,2.0] and y [2.0,2.0], with the step size of 0.01 for both x and y, calculate the value = (2 + 2 1)3 2 3.
b. For the values of [1.0,0.0] plot the point (x, y) in red.
c. For any other value of z plot the point (x, y) in color (0, 0.5, 0.5).
d. The point size will be 4.0. Do not forget to scale and translate x and y coordinates so that they are mapped correctly to the screen.
e. You should not use gluOrtho2D() and glViewport() for automatic scaling and translation, rather calculate the scaling and translation parameters manually. Your program should result in a plot like this

My Graphics App My Graphics App
Step by Step Solution
There are 3 Steps involved in it
Step: 1

Get Instant Access to Expert-Tailored Solutions
See step-by-step solutions with expert insights and AI powered tools for academic success
Step: 2

Step: 3

Ace Your Homework with AI
Get the answers you need in no time with our AI-driven, step-by-step assistance
Get Started


