Answered step by step
Verified Expert Solution
Link Copied!

Question

1 Approved Answer

1: Plot the step responses for each of the following Transfer Functions (Hint use the step function and stepinfo functions in Matlab). Label the rise
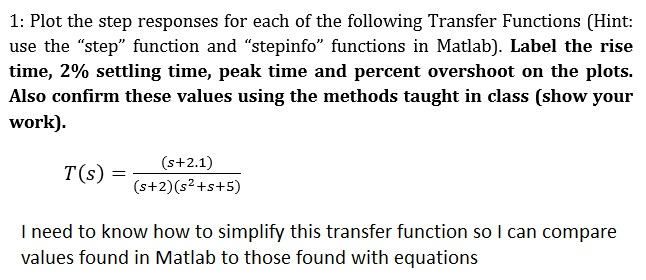
image text in transcribed

1: Plot the step responses for each of the following Transfer Functions (Hint use the "step" function and "stepinfo" functions in Matlab). Label the rise time, 2% settling time, peak time and percent overshoot on the plots. Also confirm these values using the methods taught in class (show your work). T(s)-s+2.1 (s+2) (s2+s+5) I need to know how to simplify this transfer function so I can compare values found in Matlab to those found with equation:s

Step by Step Solution

There are 3 Steps involved in it

Step: 1

blur-text-image

Get Instant Access to Expert-Tailored Solutions

See step-by-step solutions with expert insights and AI powered tools for academic success

Step: 2

blur-text-image

Step: 3

blur-text-image

Ace Your Homework with AI

Get the answers you need in no time with our AI-driven, step-by-step assistance

Get Started

Recommended Textbook for

DB2 Universal Database V7.1 Application Development Certification Guide

Authors: Steve Sanyal, David Martineau, Kevin Gashyna, Michael Kyprianou

1st Edition

0130913677, 978-0130913678

More Books

Students also viewed these Databases questions