

Question
1) Prepare an Operating Asset Management Analysis for The Buckle company by calculating the : a) current ratio b) quick ratio c) receivables turnover d)
1)
Prepare an Operating Asset Management Analysis for The Buckle company by calculating the :
a) current ratio
b) quick ratio
c) receivables turnover
d) days sales uncollected
e) inventory turnover
f) days inventory on hand
g) payables turnover
h) days payable
i) financing period
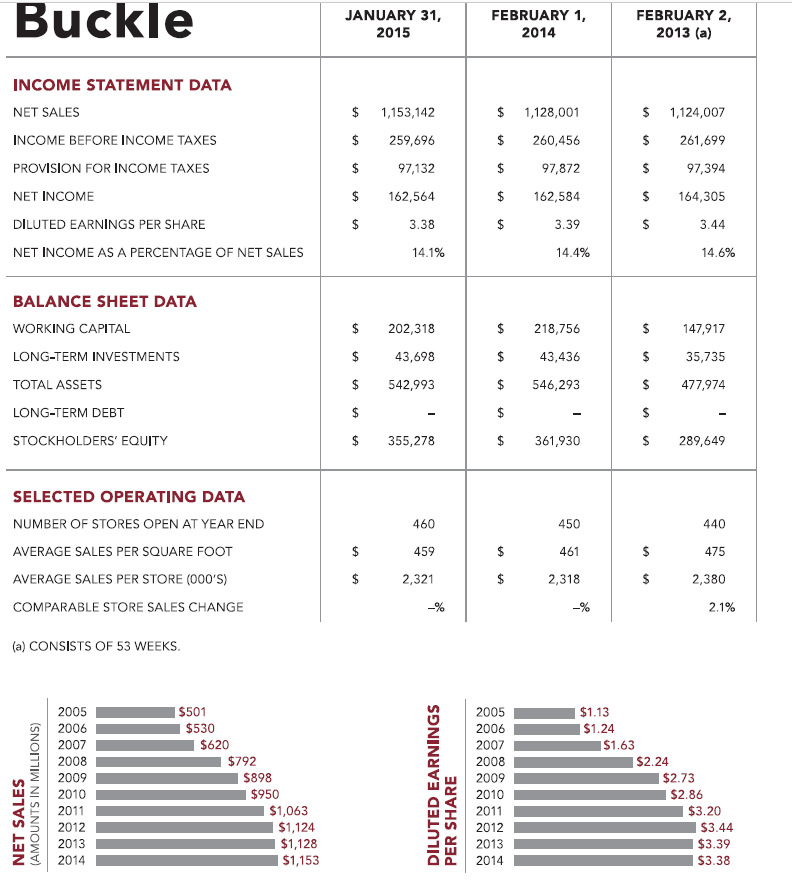
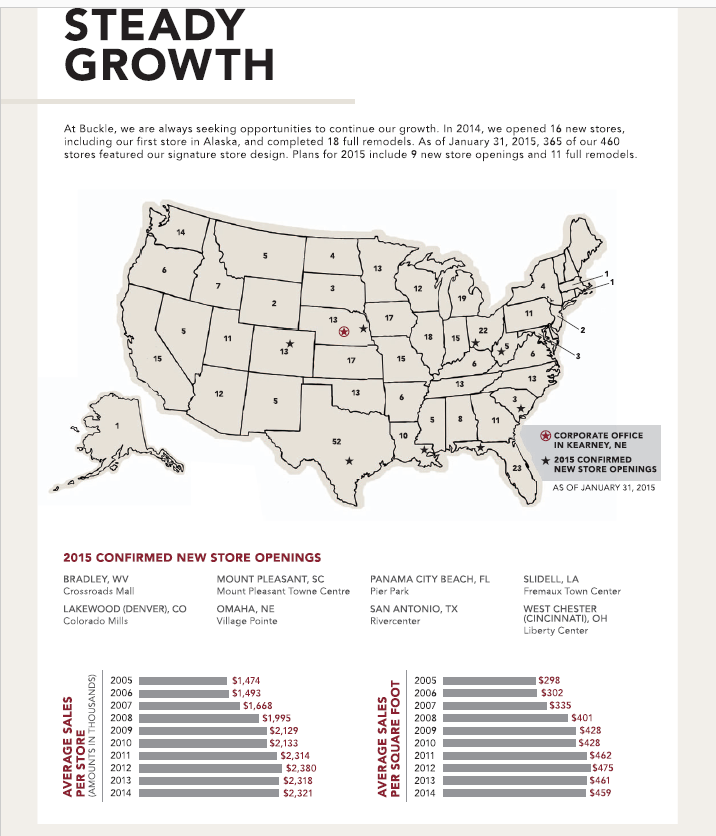
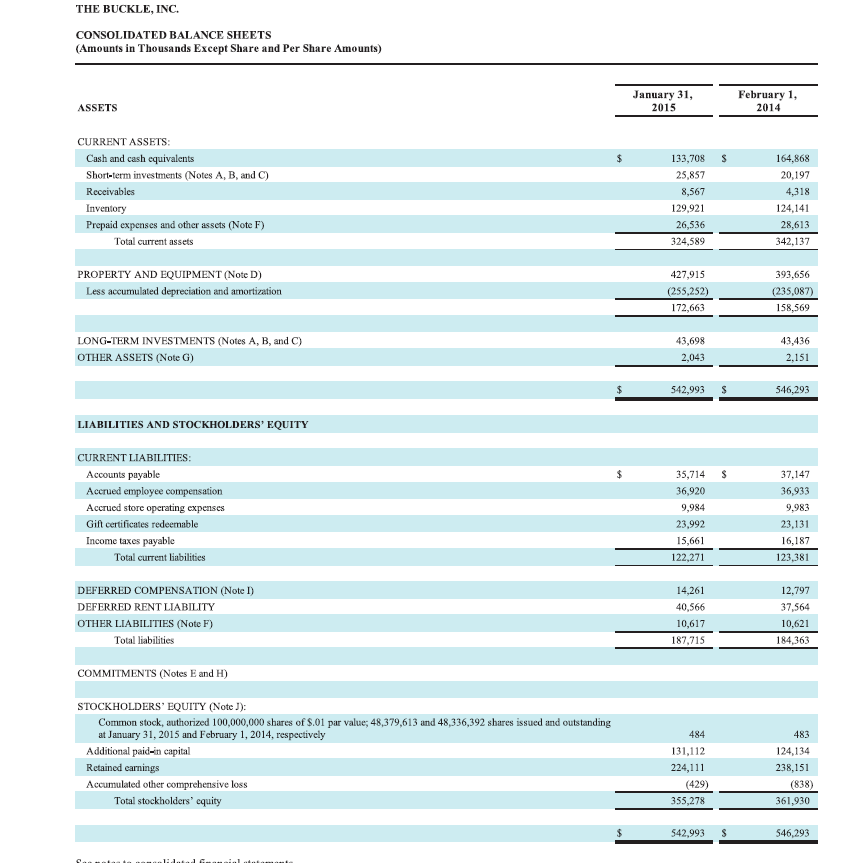
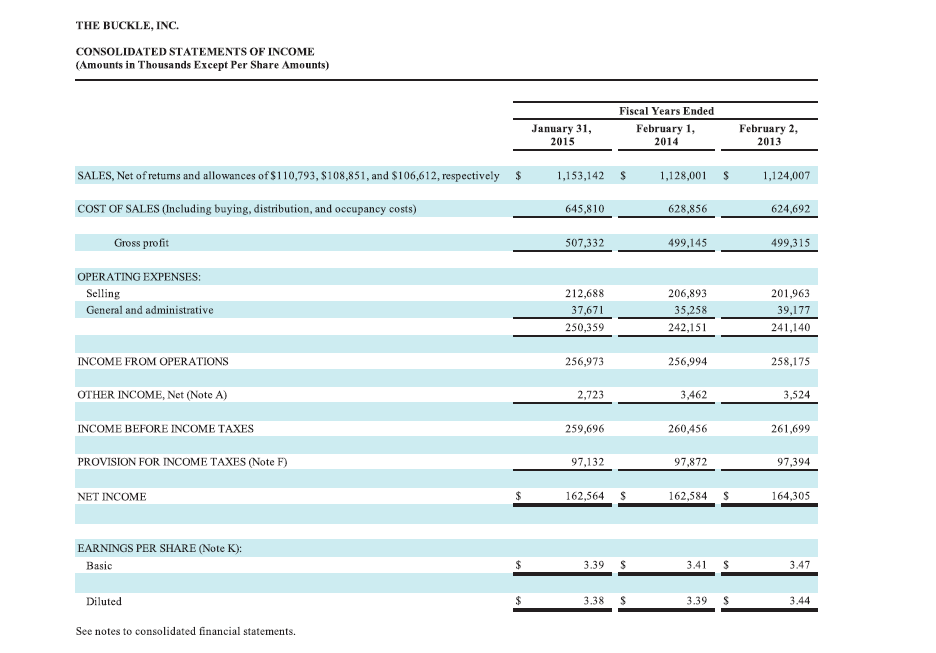
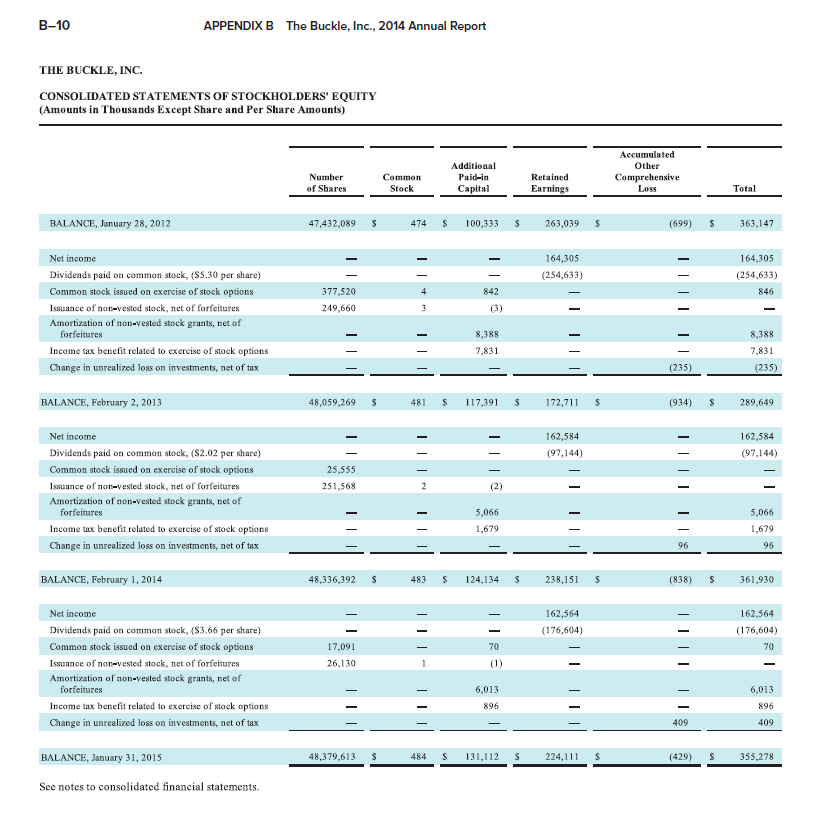
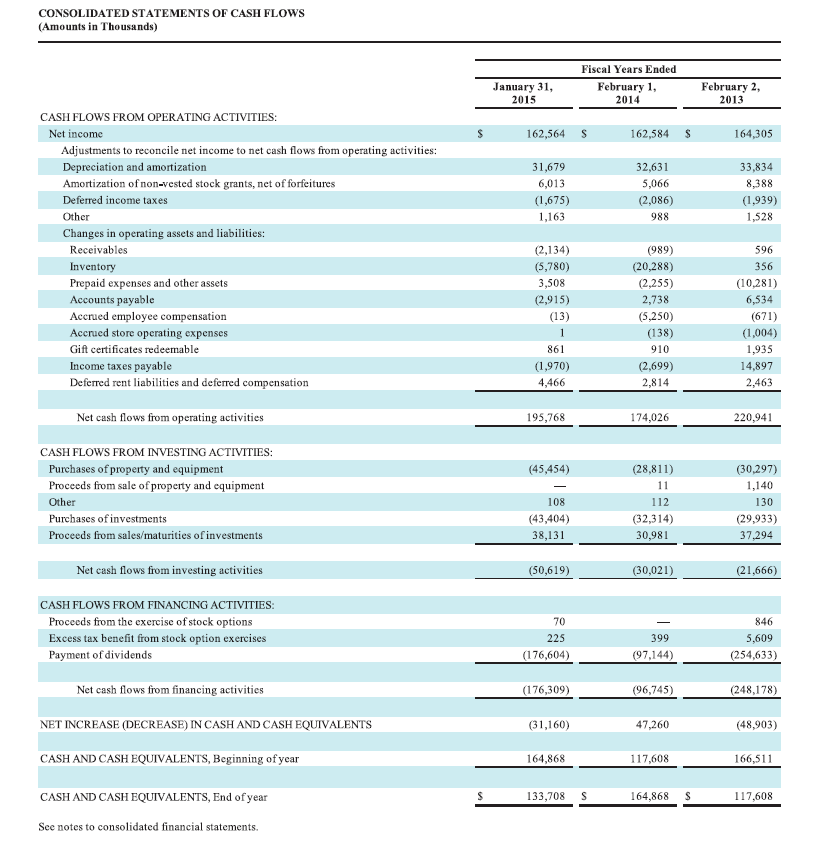
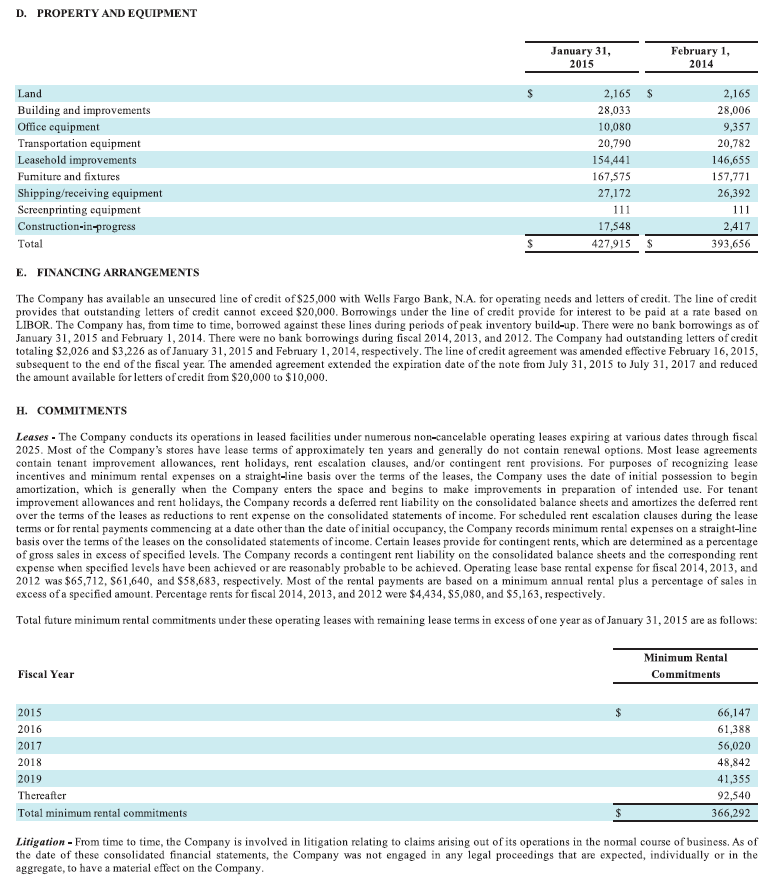
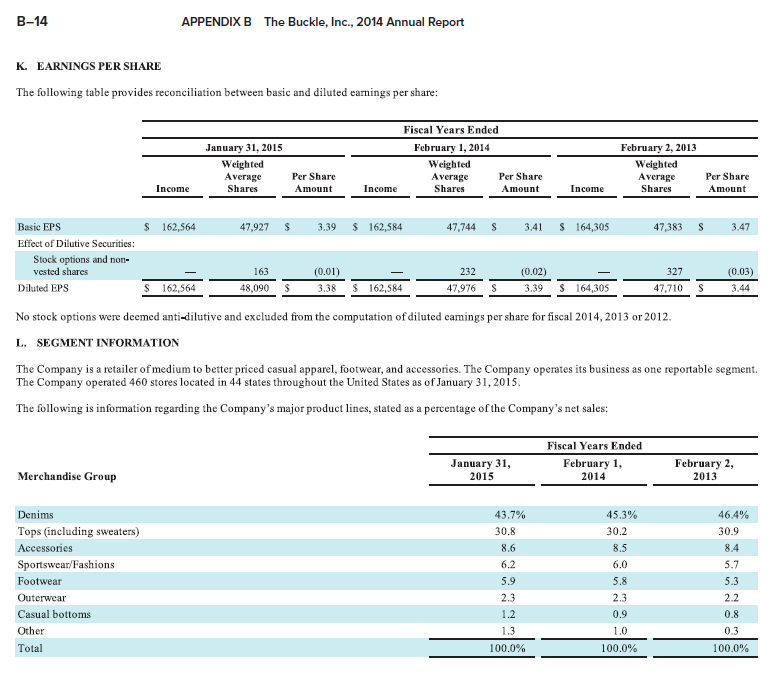
Buckle JANUARY 31, FEBRUARY 1, FEBRUARY 2, 2013 (a) 2015 2014 INCOME STATEMENT DATA NET SALES 1,153,142 1,128,001 1,124,007 INCOME BEFORE INCOME TAXES 259,696 260,456 261,699 97,132 PROVISION FOR INCOME TAXES 2$ 97,872 97,394 NET INCOME 2$ 162,564 2$ 162,584 164,305 DILUTED EARNINGS PER SHARE 24 3.38 3.39 3.44 NET INCOME AS A PERCENTAGE OF NET SALES 14.1% 14.4% 14.6% BALANCE SHEET DATA 2$ $4 WORKING CAPITAL 202,318 218,756 147,917 24 LONG-TERM INVESTMENTS 43,698 43,436 35,735 24 $4 TOTAL ASSETS 542,993 546,293 477,974 $4 24 LONG-TERM DEBT 355,278 24 361,930 STOCKHOLDERS' EQUITY 289,649 SELECTED OPERATING DATA NUMBER OF STORES OPEN AT YEAR END 460 450 440 AVERAGE SALES PER SQUARE FOOT 459 461 475 2,321 AVERAGE SALES PER STORE (000'S) 2,318 2,380 COMPARABLE STORE SALES CHANGE -% 2.1% (a) CONSISTS OF 53 WEEKS. 2005 $501 2005 $1.13 2006 $530 $1.24 2006 2007 $620 2007 |$1.63 2008 $792 $2.24 2008 2009 $898 2009 $2.73 2010 $950 2010 $2.86 $3.20 $1,063 $1,124 2011 2011 2012 2012 $3.44 $1,128 $1,153 2013 $3.39 2013 2014 $3.38 2014 %24 %24 %24 %24 24 %24 %24 %24 %24 %24 PER SHARE DILUTED EARNINGS (AMOUNTS IN MILLIONS) NET SALES STEADY GROWTH At Buckle, we are always seeking opportunities to continue our growth. In 2014, we opened 16 new stores, including our first store in Alaska, and completed 18 full remodels. As of January 31, 2015, 365 of our 460 stores featured our signature store design. Plans for 2015 include 9 new store openings and 11 full remodels. 13 12 19 11 17 13 22 18 15 13 17 13 13 12 11 O CORPORATE OFFICE IN KEARNEY, NE 10 * 2015 CONFIRMED NEW STORE OPENINGS 23 AS OF JANUARY 31, 2015 2015 CONFIRMED NEW STORE OPENINGS BRADLEY, WV Crossroads Mall MOUNT PLEASANT, SC Mount Pleasant Towne Centre PANAMA CITY BEACH, FL. Pier Park SLIDELL, LA Fremaux Town Center LAKEWOOD (DENVER), CO Colorado Mills , NE SAN ANTONIO, TX WEST CHESTER (CINCINNATI), OH Liberty Center Village Pointe Rivercenter 2005 |$298 $1,474 $1,493 | $1,668 $1,995 2005 2006 2006 $302 $335 2007 2007 2008 2008 2009 $401 $428 2009 I$2,129 2010 2011 |$2,133 2010 2011 $428 $462 $2,314 2012 $2,380 2012 2013 1S475 $461 | $459 2013 $2,318 2014 $2,321 2014 AVERAGE SALES PER STORE (AMOUNTS IN THOUSANDS) AVERAGE SALES PER SQUARE FOOT THE BUCKLE, INC. CONSOLIDATED BALANCE SHEETS (Amounts in Thousands Except Share and Per Share Amounts) January 31, February 1, 2014 ASSETS 2015 CURRENT ASSETS: Cash and cash equivalents 2$ 133,708 164,868 Short-term investments (Notes A, B, and C) 25,857 20,197 Receivables 8,567 4,318 Inventory 129,921 124,141 Prepaid expenses and other assets (Note F) 26,536 28,613 324,589 342,137 Total current assets 427,915 PROPERTY AND EQUIPMENT (Note D) 393,656 Less accumulated depreciation and amortization (255,252) (235,087) 172,663 158,569 LONG-TERM INVESTMENTS (Notes A, B, and C) 43,698 43,436 OTHER ASSETS (Note G) 2,043 2,151 542,993 24 546,293 LIABILITIES AND STOCKHOLDERS' EQUITY CURRENT LIABILITIES: Accounts payable 2$ 35,714 37,147 Accrued employee compensation 36,920 36,933 Accrued store operating expenses 9,984 9,983 Gift certificates redeemable 23,992 23,131 Income taxes payable 16,187 15,661 Total current liabilities 122,271 123,381 DEFERRED COMPENSATION (Note I) 14,261 12,797 DEFERRED RENT LIABILITY 40,566 37,564 OTHER LIABILITIES (Note F) 10,617 10,621 Total liabilities 187,715 184,363 COMMITMENTS (Notes E and H) STOCKHOLDERS' EQUITY (Note J): Common stock, authorized 100,000,000 shares of $.01 par value; 48,379,613 and 48,336,392 shares issued and outstanding at January 31, 2015 and February 1, 2014, respectively 484 483 Additional paid-in capital 131,112 124,134 Retained carnings 224,111 238,151 Accumulated other comprehensive loss (838) (429) Total stockholders' equity 361,930 355,278 542,993 546,293 lidatad Gn.nain tamanie THE BUCKLE, INC. CONSOLIDATED STATEMENTS OF INCOME (Amounts in Thousands Except Per Share Amounts) Fiscal Years Ended January 31, 2015 February 1, 2014 February 2, 2013 SALES, Net of returns and allowances of $110,793, $108,851, and $106,612, respectively $ 1,153,142 1,124,007 1,128,001 COST OF SALES (Including buying, distribution, and occupancy costs) 645,810 624,692 628,856 Gross profit 507,332 499,315 499,145 OPERATING EXPENSES: Selling 212,688 206,893 201,963 37,671 General and administrative 35,258 39,177 250,359 242,151 241,140 INCOME FROM OPERATIONS 256,973 256,994 258,175 OTHER INCOME, Net (Note A) 2,723 3,462 3,524 INCOME BEFORE INCOME TAXES 259,696 260,456 261,699 97,132 PROVISION FOR INCOME TAXES (Note F) 97,872 97,394 NET INCOME 162,564 162,584 164,305 EARNINGS PER SHARE (Note K): 3.47 Basic 3.39 3.41 3.38 3.44 Diluted 3.39 See notes to consolidated financial statements. B-10 APPENDIX B The Buckle, Inc., 2014 Annual Report THE BUCKLE, INC. CONSOLIDATED STATEMENTS OF STOCKHOLDERS' EQUITY (Amounts in Thousands Except Share and Per Share Amounts) Accumulated Additional Other Comprehensive Loss Number Common Paid-in Retained Total of Shares Stock Capital Earnings BALANCE, January 28, 2012 47,432,089 474 100,333 263,039 (699) 363,147 164,305 Net income 164,305 Dividends paid on common stock, (S5.30 per share) (254,633) (254,633) Common stock issued on exercise of stock options 377,520 842 846 Issuance of non-vested stock, net of forfeitures 249,660 (3) Amortization of non-vested stock grants, net of forfeitures 8,388 8,388 Income tax benefit related to exercise of stock options 7,831 7,831 (235) Change in unrealized loss on investments, net of tax (235) 289,649 BALANCE, February 2, 2013 48,059,269 481 117,391 172,711 (934) 162,584 Net income 162,584 Dividends paid on common stock, ($2.02 per share) (97,144) (97,144) Common stock issued on exercise of stock options 25,555 Issuance of non-vested stock, net of forfeitures 251,568 (2) Amortization of non-vested stock grants, net of forfeitures 5,066 5,066 1,679 Income tax benefit related to exercise of stock options 1,679 Change in unrealized loss on investments, net of tax 96 96 48,336,392 BALANCE, February 1, 2014 483 124,134 238,151 (838) 361,930 Net income 162,564 162,564 Dividends paid on common stock, (S3.66 per share) (176,604) (176,604) Common stock issued on exercise of stock options 17,091 70 70 Issuance of non-vested stock, net of forfeitures 26,130 (1) Amortization of non-vested stock grants, net of forfeitures 6,013 6,013 Income tax benefit related to exercise of stock options 896 896 409 Change in unrealized loss on investments, net of tax 409 48,379,613 484 131,112 224,111 (429) 355,278 BALANCE, January 31, 2015 See notes to consolidated financial statements. |||| || CONSOLIDATED STATEMENTS OF CASH FLOWS (Amounts in Thousands) Fiscal Years Ended February 1, February 2, January 31, 2015 2014 2013 CASH FLOWS FROM OPERATING ACTIVITIES: 162,564 164,305 Net income 162,584 Adjustments to reconcile net income to net cash flows from operating activities: 32,631 Depreciation and amortization 31,679 33,834 Amortization of non-vested stock grants, net of forfeitures 6,013 5,066 8,388 (1,675) (2,086) (1,939) Deferred income taxes Other 1,163 988 1,528 Changes in operating assets and liabilities: Receivables (989) (2,134) 596 (5,780) 356 Inventory (20,288) Prepaid expenses and other assets 3,508 (2,255) (10,281) (2,915) Accounts payable 2,738 6,534 (5,250) Accrued employee compensation (13) (671) Accrued store operating expenses (138) (1,004) Gift certificates redeemable 861 910 1,935 Income taxes payable (1,970) (2,699) 14,897 Deferred rent liabilities and deferred compensation 4,466 2,814 2,463 Net cash flows from operating activities 195,768 174,026 220,941 CASH FLOWS FROM INVESTING ACTIVITIES: Purchases of property and equipment Proceeds from sale of property and equipment (45,454) (28,811) (30,297) 11 1,140 Other 108 112 130 Purchases of investments (43,404) (32,314) (29,933) Proceeds from sales/maturities of investments 38,131 30,981 37,294 (21,666) Net cash flows from investing activities (50,619) (30,021) CASH FLOWS FROM FINANCING ACTIVITIES: Proceeds from the exereise of stock options 70 846 Excess tax benefit from stock option exercises Payment of dividends 225 399 5,609 (97,144) (176,604) (254,633) Net cash flows from financing activities (248,178) (176,309) (96,745) NET INCREASE (DECREASE) IN CASH AND CASH EQUIVALENTS (31,160) 47,260 (48,903) CASH AND CASH EQUIVALENTS, Beginning of year 164,868 166,511 117,608 CASH AND CASH EQUIVALENTS, End of year 164,868 117,608 133,708 See notes to consolidated financial statements. D. PROPERTY AND EQUIPMENT February 1, January 31, 2015 2014 2$ Land 2,165 2,165 Building and improvements Office equipment 28,033 28,006 10,080 9,357 Transportation equipment 20,790 20,782 Leasehold improvements 154,441 146,655 Fumiture and fixtures 167,575 157,771 Shipping/receiving equipment 27,172 26,392 Screenprinting equipment 111 111 Construction-in-progress 17,548 2,417 Total 427,915 2$ 393,656 E. FINANCING ARRANGEMENTS The Company has available an unsecured line of credit of $25,000 with Wells Fargo Bank, N.A. for operating needs and letters of credit. The line of credit provides that outstanding letters of credit cannot exceed $20,000. Borrowings under the line of credit provide for interest to be paid at a rate based on LIBOR. The Company has, from time to time, borrowed against these lines during periods of peak inventory build-up. There were no bank borrowings as of January 31, 2015 and February 1, 2014. There were no bank borowings during fiscal 2014, 2013, and 2012. The Company had outstanding letters of credit totaling $2,026 and $3,226 as of January 31, 2015 and February 1, 2014, respectively. The line of credit agreement was amended effective February 16, 2015, subsequent to the end of the fiscal year. The amended agreement extended the expiration date of the note from July 31, 2015 to July 31, 2017 and reduced the amount available for letters of credit from $20,000 to $10,000. . ITMENTS Leases - The Company conducts its operations in leased facilities under numerous non-cancelable operating leases expiring at various dates through fiscal 2025. Most of the Company's stores have lease terms of approximately ten years and generally do not contain renewal options. Most lease agreements contain tenant improvement allowances, rent holidays, rent escalation clauses, and/or contingent rent provisions. For purposes of recognizing lease incentives and minimum rental expenses on a straight-line basis over the terms of the leases, the Company uses the date of initial possession to begin amortization, which is generally when the Company enters the space and begins to make improvements in preparation of intended use. For tenant improvement allowances and rent holidays, the Company records a deferred rent liability on the consolidated balance sheets and amortizes the deferred rent over the terms of the leases as reductions to rent expense on the consolidated statements of income. For scheduled rent escalation clauses during the lease terms or for rental payments commencing at a date other than the date of initial occupancy, the Company records minimum rental expenses on a straight-line basis over the terms of the leases on the consolidated statements of income. Certain leases provide for contingent rents, which are detemined as a percentage of gross sales in excess of specified levels. The Company records a contingent rent liability on the consolidated balance sheets and the corresponding rent expense when specified levels have been achieved or are reasonably probable to be achieved. Operating lease base rental expense for fiscal 2014, 2013, and 2012 was $65,712, S61,640, and $58,683, respectively. Most of the rental payments are based on a minimum annual rental plus a percentage of sales in excess of a specified amount. Percentage rents for fiscal 2014, 2013, and 2012 were $4,434, $5,080, and $5,163, respectively. Total future minimum rental commitments under these operating leases with remaining lease tems in excess of one year as of January 31, 2015 are as follows: Minimum Rental Fiscal Year Commitments 2015 66,147 61,388 2016 2017 56,020 2018 48,842 41,355 2019 Thereafter 92,540 Total minimum rental commitments 366,292 Litigation - From time to time, the Company is involved in litigation relating to claims arising out of its operations in the nomal course of business. As of the date of these consolidated financial statements, the Company was not engaged in any legal proceedings that are expected, individually or in the aggregate, to have a material effect on the Company. %24 B-14 APPENDIX B The Buckle, Inc., 2014 Annual Report K. EARNINGS PER SHARE The following table provides reconciliation between basic and diluted earnings per share: Fiscal Years Ended January 31, 2015 February 1, 2014 February 2, 2013 Weighted Average Weighted Average Shares Weighted Average Per Share Per Share Per Share Income Shares Amount Income Amount Income Shares Amount $ 162,564 $ 164,305 3,39 $ 162,584 Basic EPS 47,927 S 47,744 3.41 47,383 3.47 Effect of Dilutive Securities: Stock options and non- vested shares 163 (0.01) 232 (0.02) 327 (0.03) S 162,564 $ 162,584 $ 164,305 Diluted EPS 48,090 3.38 47,976 3.39 47,710 3.44 No stock options were deemed anti-dilutive and excluded from the computation of diluted eamings per share for fiscal 2014, 2013 or 2012. L. SEGMENT INFORMATION The Company is a retailer of medium to better priced casual apparel, footwear, and accessories. The Company operates its business as one reportable segment. The Company operated 460 stores located in 44 states throughout the United States as of January 31, 2015. The following is information regarding the Company's major product lines, stated as a percentage of the Company's net sales: Fiscal Years Ended February 1, 2014 January 31, 2015 February 2, 2013 Merchandise Group Denims 43.7% 45.3% 46.4% Tops (including sweaters) 30.8 30.2 30.9 Accessories 8.6 8.5 8.4 Sportswear/Fashions 6.2 6.0 5.7 5.3 Footwear 5.9 5.8 Outerwear 2.3 2.3 2.2 Casual bottoms 1.2 0.9 0.8 Other 1.3 1.0 0.3 100.0% Total 100.0% 100.0%
Step by Step Solution
There are 3 Steps involved in it
Step: 1

Get Instant Access to Expert-Tailored Solutions
See step-by-step solutions with expert insights and AI powered tools for academic success
Step: 2

Step: 3
Ace Your Homework with AI
Get the answers you need in no time with our AI-driven, step-by-step assistance
Get Started
Auditing Security And Controls Of Windows Active Directory Domains
Authors: Derek Melber
1st Edition
0894135635, 978-0894135637