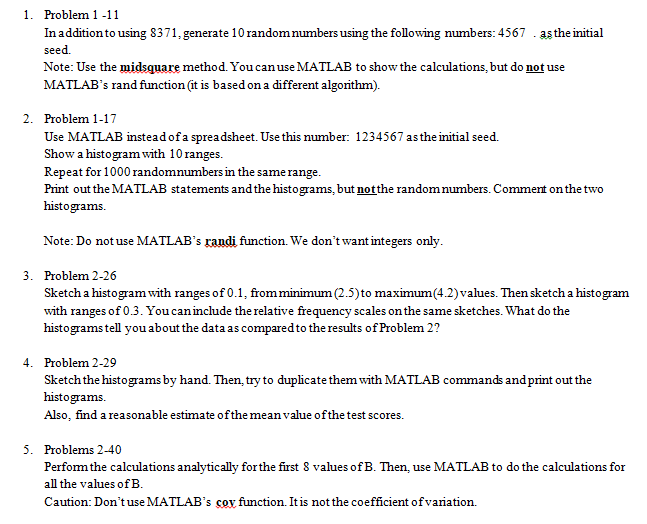
1. Problem 1-11 In addition to using 8371, generate 10 random numbers using the following numbers: 4567 as the initial seed. Note: Use the midsquare method. You can use MATLAB to show the calculations, but do not use MATLAB's rand function (it is based on a different algorithm). 2. Problem 1-17 Use MATLAB instead of a spreadsheet. Use this number: 1234567 as the initial seed. Show a histogram with 10 ranges. Repeat for 1000 randomnumbers in the same range. Print out the MATLAB statements and the histograms, but not the random numbers. Comment on the two histograms. Note: Do not use MATLAB's randi function. We don't want integers only. 3. Problem 2-26 Sketch a histogram with ranges of 0.1, from minimum (2.5) to maximum (4.2) values. Then sketch a histogram with ranges of 0.3. You can include the relative frequency scales on the same sketches. What do the histograms tell you about the data as compared to the results of Problem 2? 4. Problem 2-29 Sketch the histograms by hand. Then, try to duplicate them with MATLAB commands and print out the histograms. Also, find a reasonable estimate of the mean value of the test scores. 5. Problems 2-40 Perform the calculations analytically for the first & values of B. Then, use MATLAB to do the calculations for all the values of B. Caution: Don't use MATLAB's coy function. It is not the coefficient of variation. 1. Problem 1-11 In addition to using 8371, generate 10 random numbers using the following numbers: 4567 as the initial seed. Note: Use the midsquare method. You can use MATLAB to show the calculations, but do not use MATLAB's rand function (it is based on a different algorithm). 2. Problem 1-17 Use MATLAB instead of a spreadsheet. Use this number: 1234567 as the initial seed. Show a histogram with 10 ranges. Repeat for 1000 randomnumbers in the same range. Print out the MATLAB statements and the histograms, but not the random numbers. Comment on the two histograms. Note: Do not use MATLAB's randi function. We don't want integers only. 3. Problem 2-26 Sketch a histogram with ranges of 0.1, from minimum (2.5) to maximum (4.2) values. Then sketch a histogram with ranges of 0.3. You can include the relative frequency scales on the same sketches. What do the histograms tell you about the data as compared to the results of Problem 2? 4. Problem 2-29 Sketch the histograms by hand. Then, try to duplicate them with MATLAB commands and print out the histograms. Also, find a reasonable estimate of the mean value of the test scores. 5. Problems 2-40 Perform the calculations analytically for the first & values of B. Then, use MATLAB to do the calculations for all the values of B. Caution: Don't use MATLAB's coy function. It is not the coefficient of variation


