'1
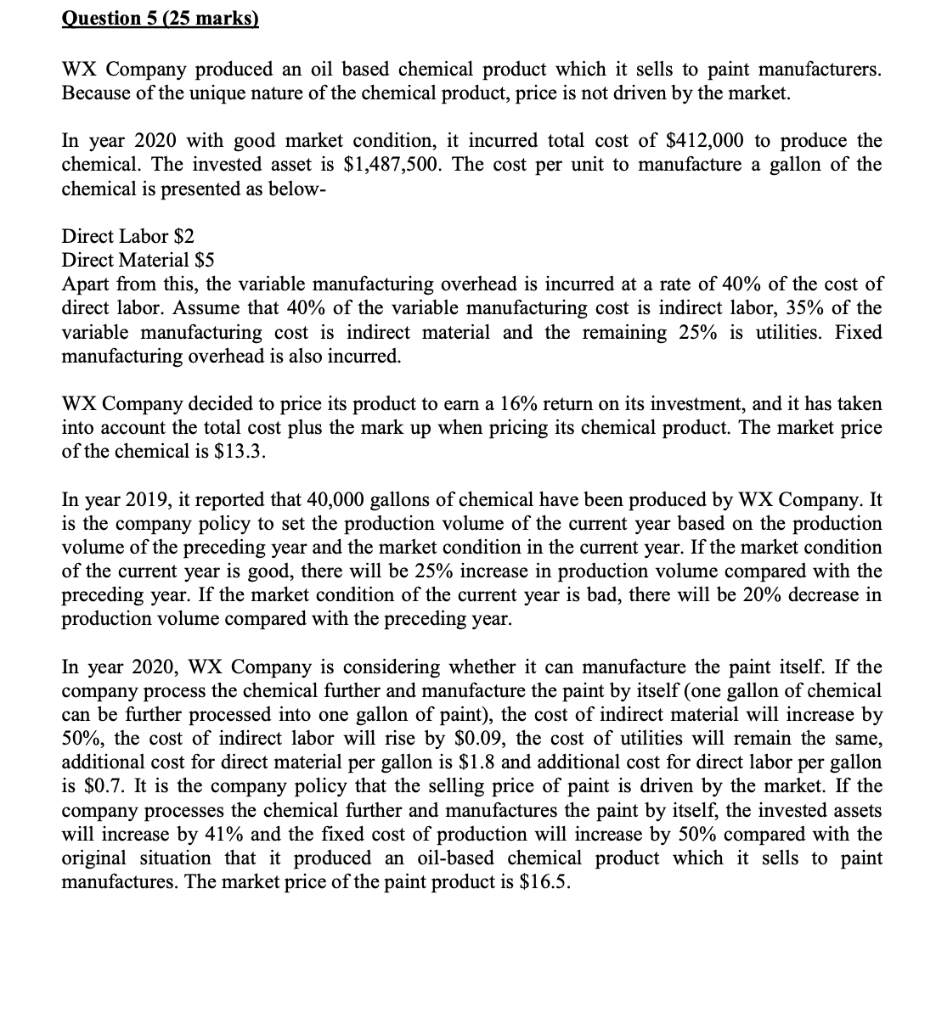
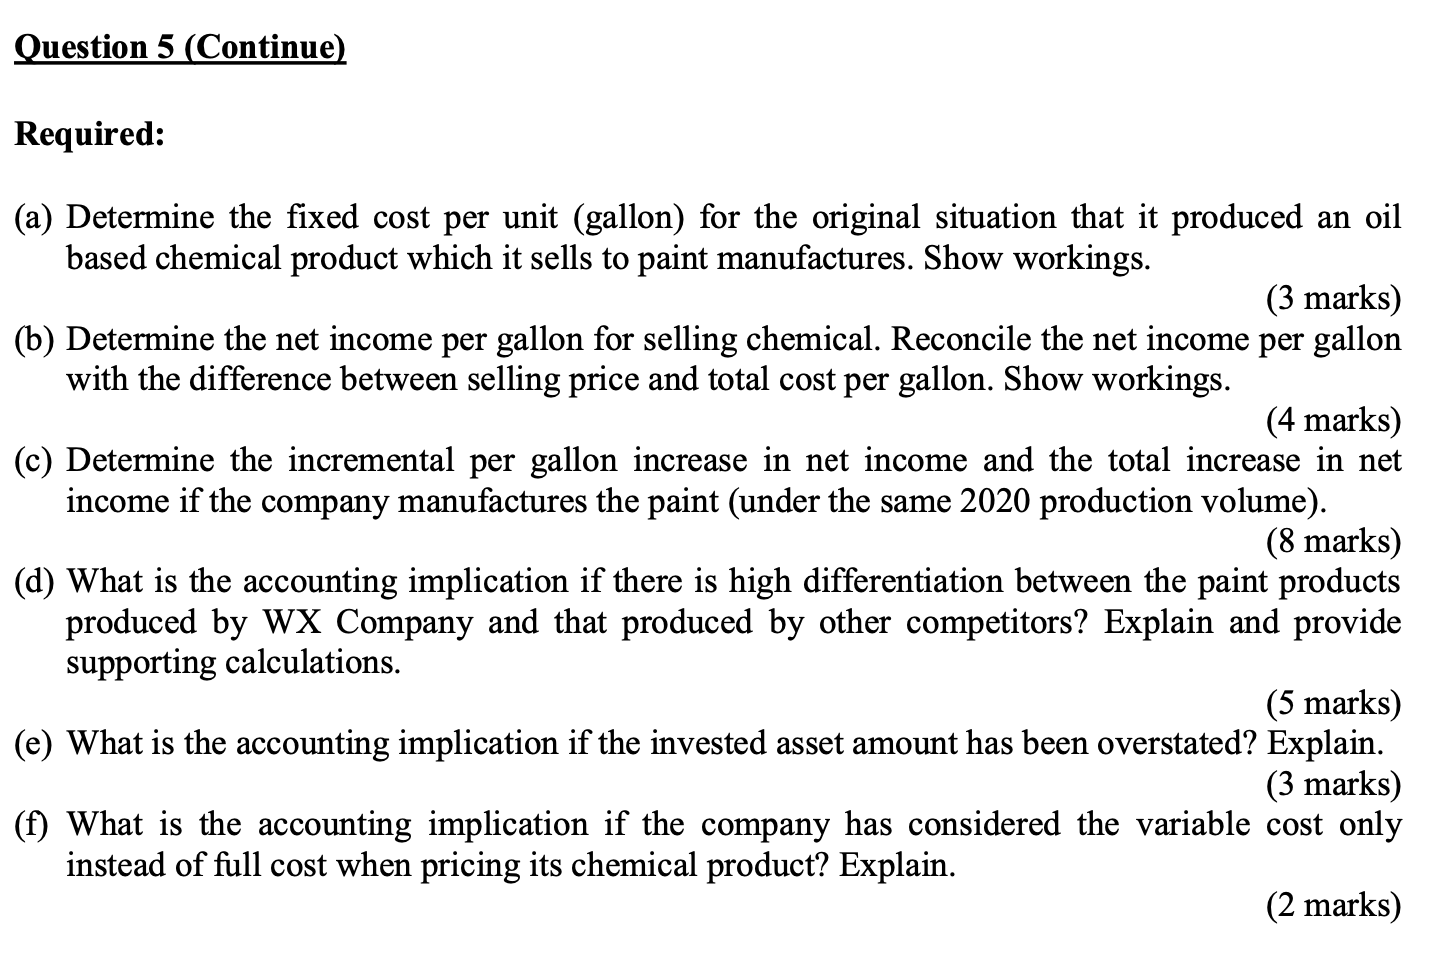
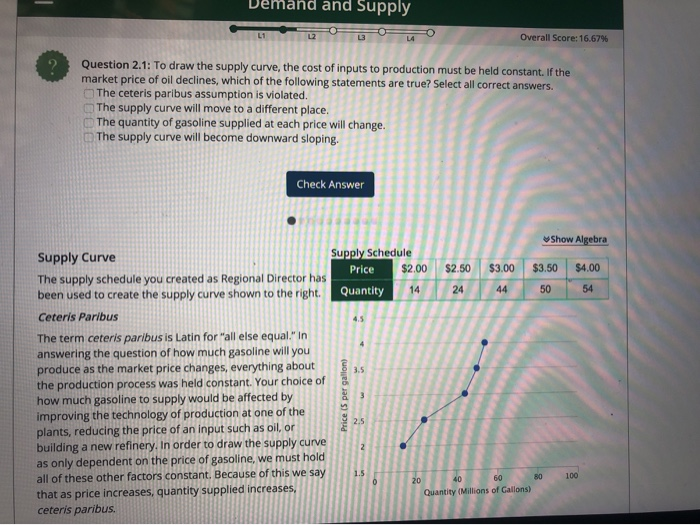
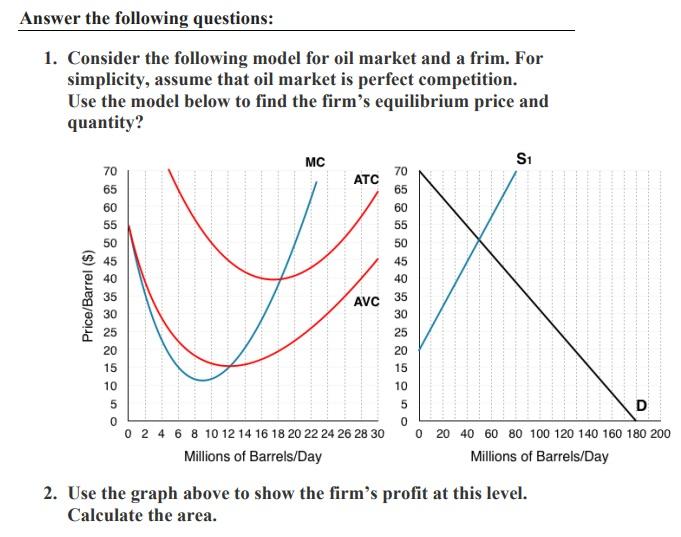
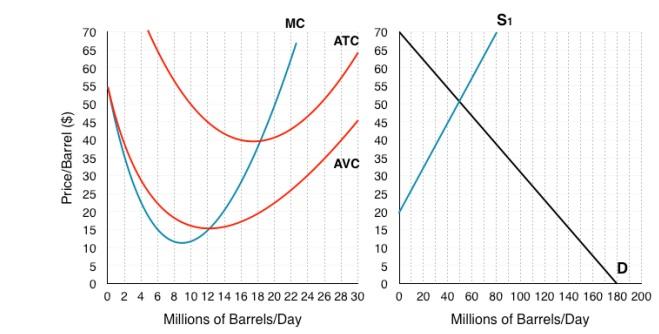
Question 5 [25 marks! WK Company produced an oil based chemical product which it sells to paint manufacturers. Because of the unique nature of the chemical product, price is not driven by the market. In year 2020 with good market condition, it incurred total cost of $412,000 to produce the chemical. The invested asset is $1,487,500. The cost per unit to manufacture a gallon of the chemical is presented as below- Direct Labor $2 Direct Material $5 Apart from this, the variable manufacturing overhead is incurred at a rate of 40% of the cost of direct labor. Assume that 40% of the variable manufacturing cost is indirect labor, 35% of the variable manufacturing cost is indirect material and the remaining 25% is utilities. Fixed manufacturing overhead is also incurred. WX Company decided to price its product to earn a 16% return on its investment, and it has taken into account the total cost plus the mark up when pricing its chemical product. The market price of the chemical is $13.3. In year 2019, it reported that 40,000 gallons of chemical have been produced by WX Company. It is the company policy to set the production volume of the current year based on the production volume of the preceding year and the market condition in the current year. If the market condition of the current year is good, there will be 25% increase in production volume compared with the preceding year. If the market condition of the current year is bad, there will be 20% decrease in production volume compared with the preceding year. In year 2020, WX Company is considering whether it can manufacture the paint itself. If the company process the chemical further and manufacture the paint by itself (one gallon of chemical can be further processed into one gallon of paint), the cost of indirect material will increase by 50%, the cost of indirect labor will rise by $0.09, the cost of utilities wl remain the same, additional cost for direct material per gallon is $1.3 and additional cost for direct labor per gallon is $0.7. It is the company policy that the selling price of paint is driven by the market. If the company processes the chemical further and manufactures the paint by itself, the invested assets will increase by 41% and the xed cost of production will increase by 50% compared with the original situation that it produced an oil-based chemical product which it sells to paint manuactures. The market price of the paint product is $16.5. Question 5 (Continue! Required: (a) Determine the xed cost per unit (gallon) for the original situation that it produced an oil based chemical product which it sells to paint manufactures. Show workings. (3 marks) (b) Determine the net income per gallon for selling chemical. Reconcile the net income per gallon with the difference between selling price and total cost per gallon. Show workings. (4 marks) (0) Determine the incremental per gallon increase in net income and the total increase in net income if the company manufactures the paint (under the same 2020 production volume). (8 marks) ((1) What is the accounting implication if there is high differentiation between the paint products produced by WX Company and that produced by other competitors? Explain and provide supporting calculations. (5 marks) (e) What is the accounting implication if the invested asset amount has been overstated? Explain. (3 marks) (f) What is the accounting implication if the company has considered the variable cost only instead of full cost when pricing its chemical product? Explain. (2 marks) This Question: 1 pt 1 5 of 10 (0 complete) This Quiz: 10 pts possible Question Help The following table shows a breakdown of gasoline prices. Let C represent crude oil, T represent taxes, R represent refining, and D represent distribution and marketing. Choose the Component Percentage correct chart below. Crude Oil 61.0% OA. O B. Taxes 15.6% Refining 13.9% Distribution and 9.5% marketing O C. OD. Construct a pie chart summarizing these data.Demand and Supply 13 LA Overall Score: 16.679% Question 2.1: To draw the supply curve, the cost of inputs to production must be held constant. If the market price of oil declines, which of the following statements are true? Select all correct answers. The ceteris paribus assumption is violated. The supply curve will move to a different place. The quantity of gasoline supplied at each price will change. )The supply curve will become downward sloping. Check Answer $Show Algebra Supply Curve Supply Schedule Price $2.00 $2.50 $3.00 $3.50 $4.00 The supply schedule you created as Regional Director has been used to create the supply curve shown to the right. Quantity 14 24 44 50 54 Ceteris Paribus The term ceteris paribus is Latin for "all else equal." In answering the question of how much gasoline will you produce as the market price changes, everything about the production process was held constant. Your choice of how much gasoline to supply would be affected by Price (5 per gallon) improving the technology of production at one of the plants, reducing the price of an input such as oil, or building a new refinery. In order to draw the supply curve as only dependent on the price of gasoline, we must hold all of these other factors constant. Because of this we say 40 60 50 100 that as price increases, quantity supplied increases, Quantity (Millions of Gallons) ceteris paribus.Answer the following questions: 1. Consider the following model for oil market and a frim. For simplicity, assume that oil market is perfect competition. Use the model below to find the firm's equilibrium price and quantity? MC S1 70 ATC 70 65 65 60 X Price/Barrel ($) AVC OD6 8 0 8 8 8 6 8 8 8 10 D 0 2 4 6 8 10 12 14 16 18 20 22 24 26 28 30 0 20 40 60 80 100 120 140 160 180 200 Millions of Barrels/Day Millions of Barrels/Day 2. Use the graph above to show the firm's profit at this level. Calculate the area.3. As a result of question 2, what will happen in the long-run? Show this on the graph below.MC S1 70 70 ATC 65 65 60 60 55 40 Price/Barrel ($) AVC 35 30 25 20 5 D 0 2 4 6 8 10 12 14 16 18 20 22 24 26 28 30 0 20 40 60 80 100 120 140 160 180 200 Millions of Barrels/Day Millions of Barrels/Day
