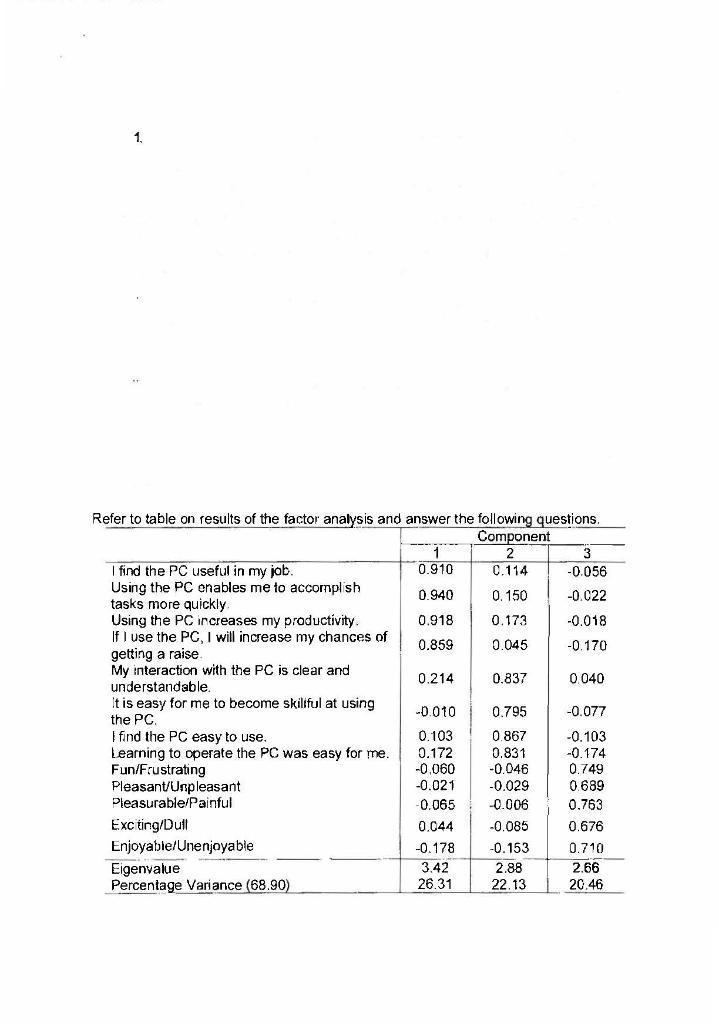
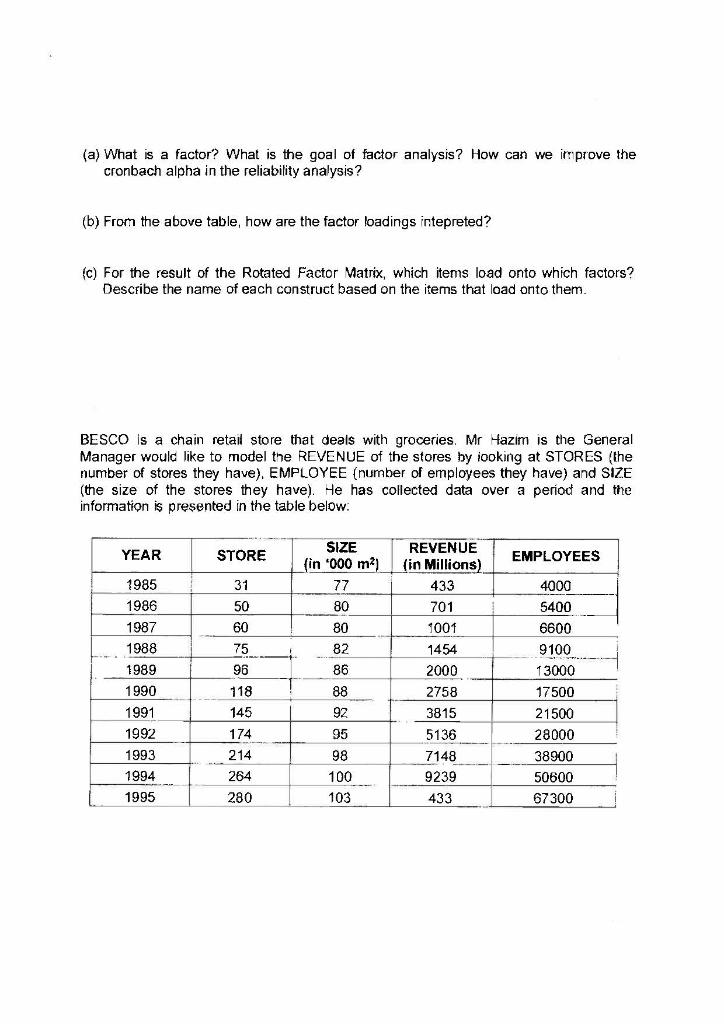
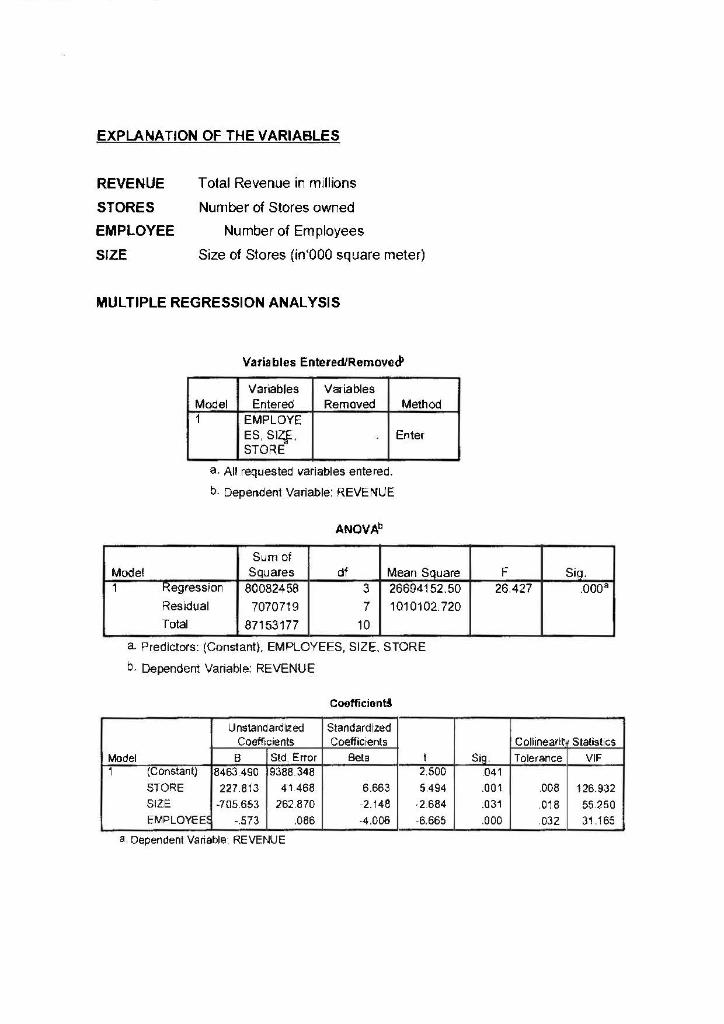
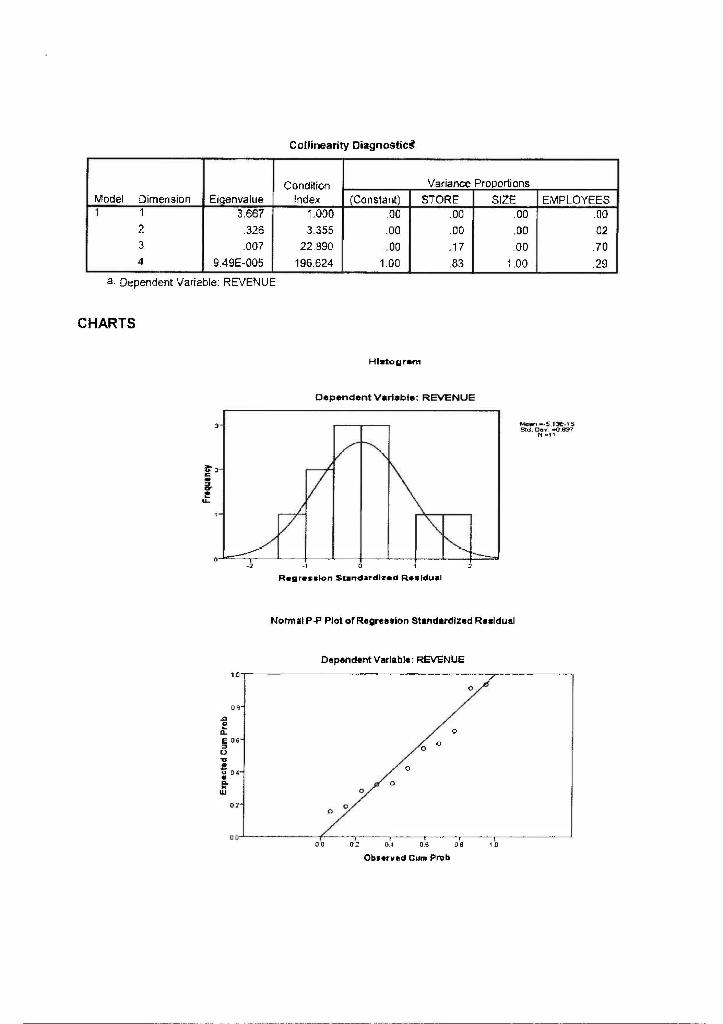
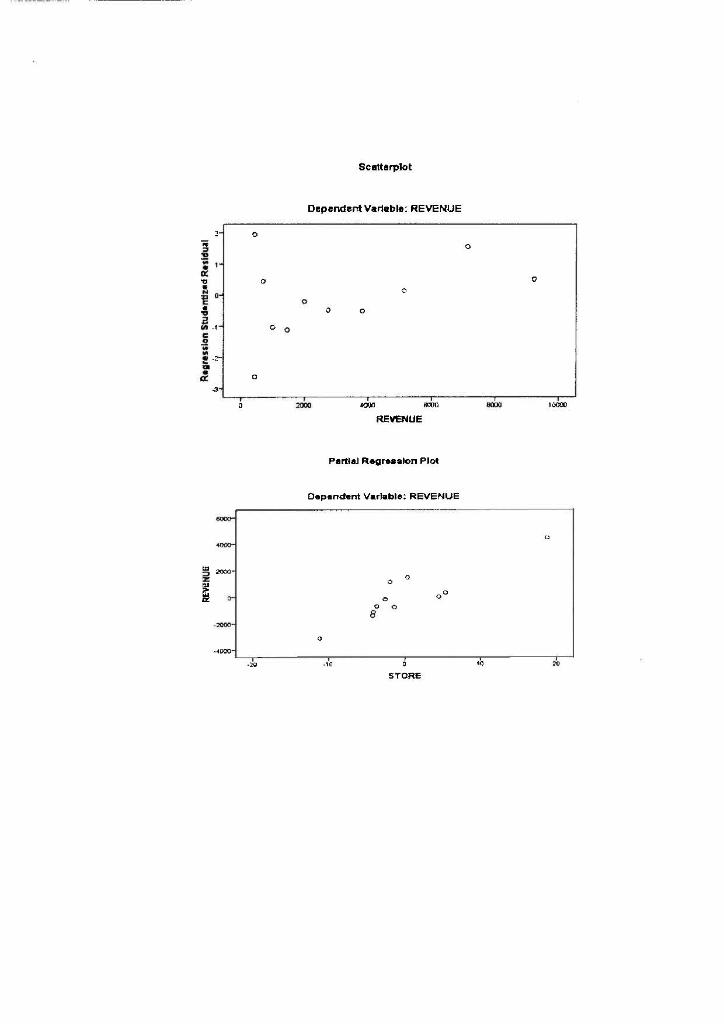
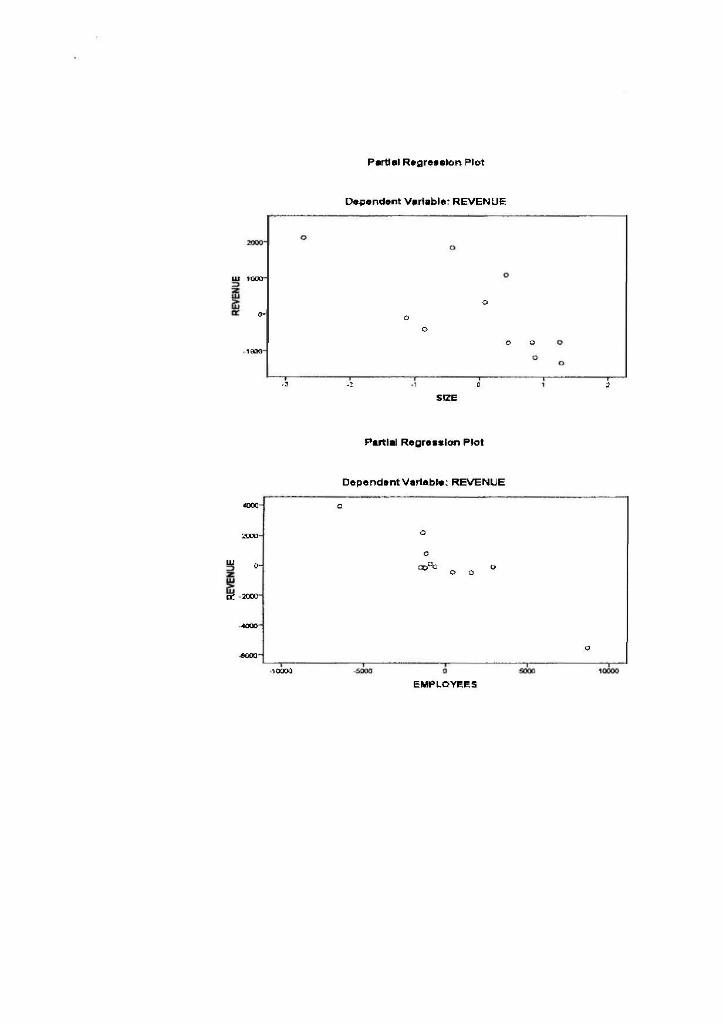
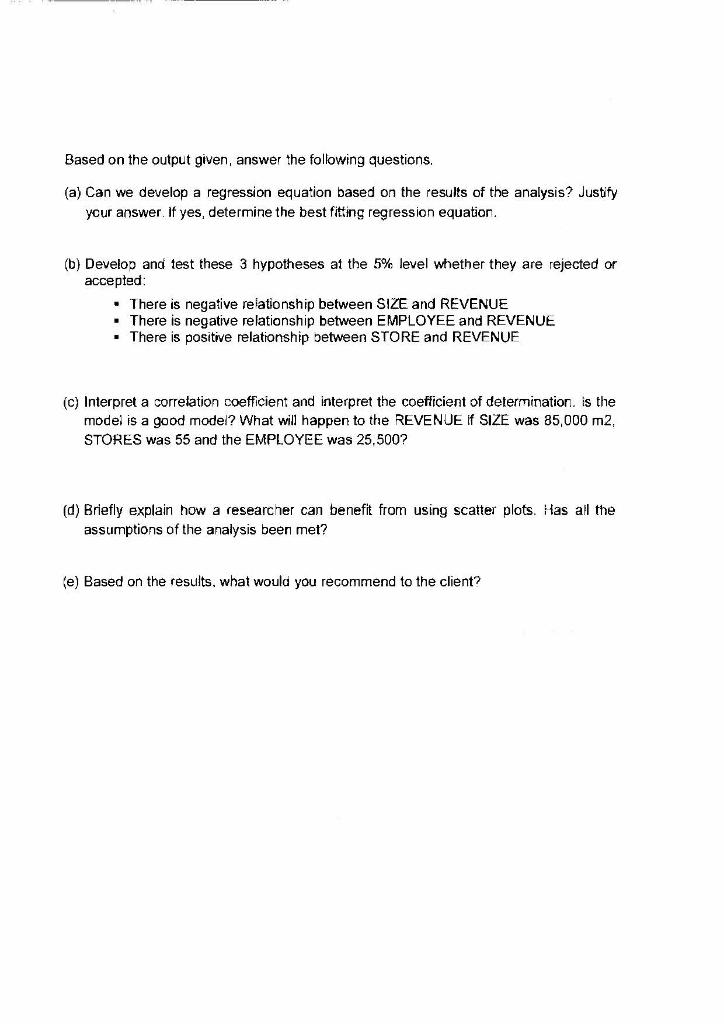
1, Refer to table on results of the factor analysis and answer the following questions. Component 1 2 3 I find the PC useful in my job. 0.910 C.114 -0.056 Using the PC enables me to accomplish 0.940 0.150 -0.022 tasks more quickly Using the PC increases my productivity 0.918 0.173 -0.018 If I use the PC, I will increase my chances of 0.859 0.045 -0.170 getting a raise My interaction with the PC is clear and 0.214 0.837 0.040 understandable. It is easy for me to become skillful at using -0.010 0.795 -0.077 I find the PC easy to use. 0.103 0.867 -0.103 Learning to operate the PC was easy for me. 0.172 0.831 -0.174 Fun/Frustrating -0.060 -0.046 0.749 Pleasant/Unpleasant -0.021 -0.029 0.689 Pleasurable/Painful -0.065 -0.006 0.763 Exc ting/Dull 0.044 -0.085 0.676 Enjoyable/Unenjoyable -0.178 -0.153 0.710 Eigenvalue 3.42 2.88 2.66 Percentage Variance (68.90) 26.31 22.13 20.46 the PC (a) What is a factor? What is the goal of factor analysis? How can we improve the Cronbach alpha in the reliability analysis? (b) From the above table, how are the factor loadings intepreted? (c) For the result of the Rotated Factor Matrix, which items load onto which factors? Describe the name of each construct based on the items that load onto them. BESCO is a chain retail store that deals with groceries. Mr Hazim is the General Manager would like to model the REVENUE of the stores by looking at STORES (the number of stores they have), EMPLOYEE (number of employees they have) and SIZE (the size of the stores they have). He has collected data over a period and the information is presented in the table below: YEAR STORE EMPLOYEES SIZE fin '000 m) 77 80 REVENUE (in Millions) 433 701 1985 1986 1987 1988 80 1001 1989 31 50 60 75 96 118 145 174 214 264 280 82 86 88 1454 2000 2758 3815 5136 4000 5400 6600 9100 13000 17500 21500 28000 38900 50600 67300 1990 1991 1992 1993 1994 1995 92 95 7148 98 100 9239 433 103 EXPLANATION OF THE VARIABLES REVENUE STORES EMPLOYEE SIZE Total Revenue in millions Number of Stores owned Number of Employees Size of Stores (in'000 square meter) MULTIPLE REGRESSION ANALYSIS Variables Entered/Removed Variables Vaiables Model Entered Removed Method 1 EMPLOYE ES SIZE Enter STORE a. All requested variables entered. 5. Dependent Variable: REVENUE ANOVAL F 26.427 Sig. .000 Sum of Model Squares ot Mean Square 1 Regression 80082458 3 26694152.50 Residual 7070719 71010102.720 Total 87153177 10 a Predictors: (Constant), EMPLOYEES, SIZE, STORE b. Dependent Variable: REVENUE Coofficiants Standardized Coefficients Bela Colineartt Stalist cs Tolerance VIF Unstandard ked Coefficients Model B Sid Error (Constant) 8463 490 19388 348 STORE 227.813 41.468 Size -705.653 262.870 EMPLOYEES - 573 .086 a Dependent Variable REVENUE 6.663 2.148 -4.006 1 2.SOD 5494 2.684 -6.665 Sig 041 .001 .031 .000 008 018 032 126.932 55 250 31.165 Collinearity Diagnostic (Constant) EMPLOYEES .00 Condition Index 1090 3.355 22.990 196.624 Model Dimension Eigenvalue 1 1 3.667 2 .326 3 2007 4 9.49E-005 2. Dependent Variable: REVENUE 02 Variance Proportions STORE SIZE .00 .00 .DO ,00 17 00 83 1.00 30 .00 00 1.00 .70 29 CHARTS Histogram Dependent variable: REVENUE Mew 5 10.15 1993 3 Regression Standardized Residual Noma P P Plot of Regression Standardized Rusldual Dependent Variable: REVENUE 12T 09- 06 o D4- 024 00 1 D'S 02 0.5 Observed Gum Proba Scatterplot Dependent Variable: REVENUE Regression Studentized Residual wa BODY 10620 REVENUE Partial Regresalon Plot Dependent Variable: REVENUE 09 1 3 STORE Partial Regression Plot Dependent Variable: REVENUE w 1000 O 100% SIZE Partial Regrosslon Plot Dependant Variable: REVENUE 4000 a ZUU c DEL REVENUE 2000- 4000 8000 10000 song 5000 10000 EMPLOYEES Based on the output given, answer the following questions. (a) Can we develop a regression equation based on the results of the analysis? Justify your answer. If yes, determine the best fitting regression equation. (b) Develop and test these 3 hypotheses at the 5% level whether they are rejected or accepted: There is negative relationship between SIZE and REVENUE There is negative relationship between EMPLOYEE and REVENUE There is positive relationship between STORE and REVENUE (c) Interpret a correlation coefficient and interpret the coefficient of determination is the model is a good model? What will happen to the REVENUE IF SIZE was 85,000 m2, STORES was 55 and the EMPLOYEE was 25,500? (d) Briefly explain how a researcher can benefit from using scatter plots. Has all the assumptions of the analysis been met? (e) Based on the results, what would you recommend to the client? 1, Refer to table on results of the factor analysis and answer the following questions. Component 1 2 3 I find the PC useful in my job. 0.910 C.114 -0.056 Using the PC enables me to accomplish 0.940 0.150 -0.022 tasks more quickly Using the PC increases my productivity 0.918 0.173 -0.018 If I use the PC, I will increase my chances of 0.859 0.045 -0.170 getting a raise My interaction with the PC is clear and 0.214 0.837 0.040 understandable. It is easy for me to become skillful at using -0.010 0.795 -0.077 I find the PC easy to use. 0.103 0.867 -0.103 Learning to operate the PC was easy for me. 0.172 0.831 -0.174 Fun/Frustrating -0.060 -0.046 0.749 Pleasant/Unpleasant -0.021 -0.029 0.689 Pleasurable/Painful -0.065 -0.006 0.763 Exc ting/Dull 0.044 -0.085 0.676 Enjoyable/Unenjoyable -0.178 -0.153 0.710 Eigenvalue 3.42 2.88 2.66 Percentage Variance (68.90) 26.31 22.13 20.46 the PC (a) What is a factor? What is the goal of factor analysis? How can we improve the Cronbach alpha in the reliability analysis? (b) From the above table, how are the factor loadings intepreted? (c) For the result of the Rotated Factor Matrix, which items load onto which factors? Describe the name of each construct based on the items that load onto them. BESCO is a chain retail store that deals with groceries. Mr Hazim is the General Manager would like to model the REVENUE of the stores by looking at STORES (the number of stores they have), EMPLOYEE (number of employees they have) and SIZE (the size of the stores they have). He has collected data over a period and the information is presented in the table below: YEAR STORE EMPLOYEES SIZE fin '000 m) 77 80 REVENUE (in Millions) 433 701 1985 1986 1987 1988 80 1001 1989 31 50 60 75 96 118 145 174 214 264 280 82 86 88 1454 2000 2758 3815 5136 4000 5400 6600 9100 13000 17500 21500 28000 38900 50600 67300 1990 1991 1992 1993 1994 1995 92 95 7148 98 100 9239 433 103 EXPLANATION OF THE VARIABLES REVENUE STORES EMPLOYEE SIZE Total Revenue in millions Number of Stores owned Number of Employees Size of Stores (in'000 square meter) MULTIPLE REGRESSION ANALYSIS Variables Entered/Removed Variables Vaiables Model Entered Removed Method 1 EMPLOYE ES SIZE Enter STORE a. All requested variables entered. 5. Dependent Variable: REVENUE ANOVAL F 26.427 Sig. .000 Sum of Model Squares ot Mean Square 1 Regression 80082458 3 26694152.50 Residual 7070719 71010102.720 Total 87153177 10 a Predictors: (Constant), EMPLOYEES, SIZE, STORE b. Dependent Variable: REVENUE Coofficiants Standardized Coefficients Bela Colineartt Stalist cs Tolerance VIF Unstandard ked Coefficients Model B Sid Error (Constant) 8463 490 19388 348 STORE 227.813 41.468 Size -705.653 262.870 EMPLOYEES - 573 .086 a Dependent Variable REVENUE 6.663 2.148 -4.006 1 2.SOD 5494 2.684 -6.665 Sig 041 .001 .031 .000 008 018 032 126.932 55 250 31.165 Collinearity Diagnostic (Constant) EMPLOYEES .00 Condition Index 1090 3.355 22.990 196.624 Model Dimension Eigenvalue 1 1 3.667 2 .326 3 2007 4 9.49E-005 2. Dependent Variable: REVENUE 02 Variance Proportions STORE SIZE .00 .00 .DO ,00 17 00 83 1.00 30 .00 00 1.00 .70 29 CHARTS Histogram Dependent variable: REVENUE Mew 5 10.15 1993 3 Regression Standardized Residual Noma P P Plot of Regression Standardized Rusldual Dependent Variable: REVENUE 12T 09- 06 o D4- 024 00 1 D'S 02 0.5 Observed Gum Proba Scatterplot Dependent Variable: REVENUE Regression Studentized Residual wa BODY 10620 REVENUE Partial Regresalon Plot Dependent Variable: REVENUE 09 1 3 STORE Partial Regression Plot Dependent Variable: REVENUE w 1000 O 100% SIZE Partial Regrosslon Plot Dependant Variable: REVENUE 4000 a ZUU c DEL REVENUE 2000- 4000 8000 10000 song 5000 10000 EMPLOYEES Based on the output given, answer the following questions. (a) Can we develop a regression equation based on the results of the analysis? Justify your answer. If yes, determine the best fitting regression equation. (b) Develop and test these 3 hypotheses at the 5% level whether they are rejected or accepted: There is negative relationship between SIZE and REVENUE There is negative relationship between EMPLOYEE and REVENUE There is positive relationship between STORE and REVENUE (c) Interpret a correlation coefficient and interpret the coefficient of determination is the model is a good model? What will happen to the REVENUE IF SIZE was 85,000 m2, STORES was 55 and the EMPLOYEE was 25,500? (d) Briefly explain how a researcher can benefit from using scatter plots. Has all the assumptions of the analysis been met? (e) Based on the results, what would you recommend to the client


