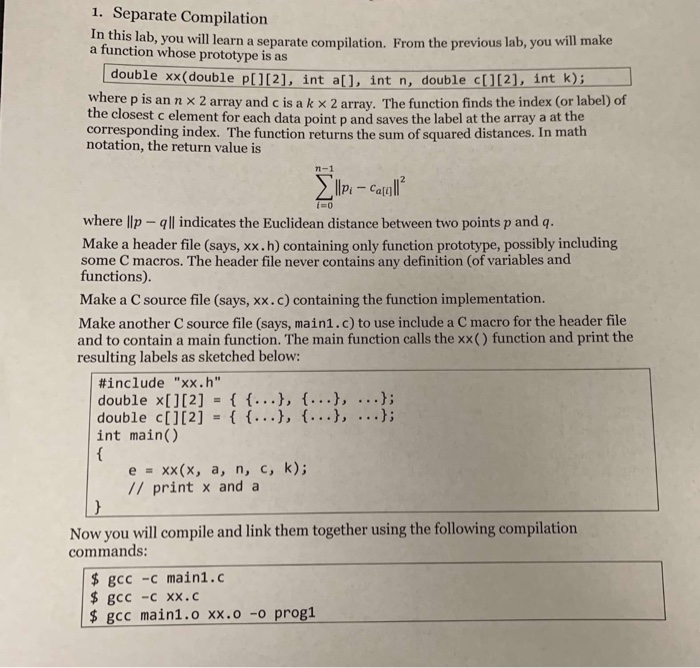
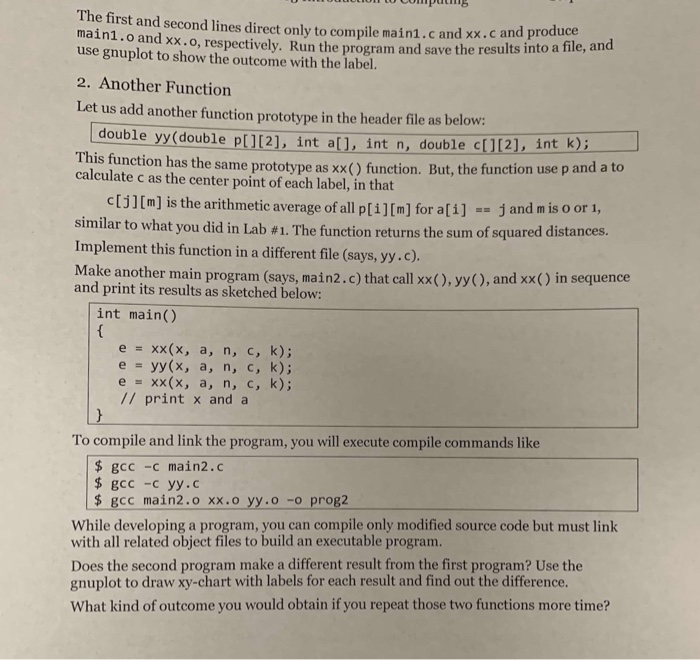
1. Separate Compilation In this lab, you will learn a separate compilation. From the previous lab, you will make a function whose prototype is as double xx(double P[][2], int a[], int n, double c[][2], int k); where p is an n x 2 array and c is a k x 2 array. The function finds the index (or label) of the closest c element for each data point p and saves the label at the array a at the corresponding index. The function returns the sum of squared distances. In math notation, the return value is ||pi - Catoll where Ip - || indicates the Euclidean distance between two points p and q. Make a header file (says, xx.h) containing only function prototype, possibly including some C macros. The header file never contains any definition of variables and functions) Make a C source file (says, xx.c) containing the function implementation. Make another source file (says, main1.c) to use include a C macro for the header file and to contain a main function. The main function calls the xx() function and print the resulting labels as sketched below: #include "xx.h" double x[][2] = { {...}, {...}, ... }; double c[][2] = { {...}, {...}, ...); int main() e = XX(X, a, n, c, k); // print x and a Now you will compile and link them together using the following compilation commands: $ gcc -c maini.c $ gcc -C XX.C $ gcc main1.0 xx.0 -o prog1 DULUI U Lumpun The first and second lines direct only to compile maini.c and xx.c and P 2.0 and xx.o, respectively. Run the program and save the results into a file, and use gnuplot to show the outcome with the label. 2. Another Function Let us add another function prototype in the header file as below: double yy (double pl [2], int all, int n, double c[][2], int k); This function has the same prototype as xx(function. But, the function use p and a to calculate c as the center point of each label, in that [3][m) is the arithmetic average of all p[i][m] for a[i] - J and mis o or 1, similar to what you did in Lab #1. The function returns the sum of squared distances. Implement this function in a different file (says, yy.c). Make another main program (says, main2.c) that call xx(), yy(), and xx() in sequence and print its results as sketched below: int main() e = xx(x, a, n, c, k); e = y (x, a, n, c, k); e - xx(x, a, n, C, k); // print x and a To compile and link the program, you will execute compile commands like $ gcc -c main2.c $ gcc -c yy.c $ gcc main2.0 xx.0 yy.o -o prog2 While developing a program, you can compile only modified source code but must link with all related object files to build an executable program. Does the second program make a different result from the first program? Use the gnuplot to draw xy-chart with labels for each result and find out the difference. What kind of outcome you would obtain if you repeat those two functions more time? 1. Separate Compilation In this lab, you will learn a separate compilation. From the previous lab, you will make a function whose prototype is as double xx(double P[][2], int a[], int n, double c[][2], int k); where p is an n x 2 array and c is a k x 2 array. The function finds the index (or label) of the closest c element for each data point p and saves the label at the array a at the corresponding index. The function returns the sum of squared distances. In math notation, the return value is ||pi - Catoll where Ip - || indicates the Euclidean distance between two points p and q. Make a header file (says, xx.h) containing only function prototype, possibly including some C macros. The header file never contains any definition of variables and functions) Make a C source file (says, xx.c) containing the function implementation. Make another source file (says, main1.c) to use include a C macro for the header file and to contain a main function. The main function calls the xx() function and print the resulting labels as sketched below: #include "xx.h" double x[][2] = { {...}, {...}, ... }; double c[][2] = { {...}, {...}, ...); int main() e = XX(X, a, n, c, k); // print x and a Now you will compile and link them together using the following compilation commands: $ gcc -c maini.c $ gcc -C XX.C $ gcc main1.0 xx.0 -o prog1 DULUI U Lumpun The first and second lines direct only to compile maini.c and xx.c and P 2.0 and xx.o, respectively. Run the program and save the results into a file, and use gnuplot to show the outcome with the label. 2. Another Function Let us add another function prototype in the header file as below: double yy (double pl [2], int all, int n, double c[][2], int k); This function has the same prototype as xx(function. But, the function use p and a to calculate c as the center point of each label, in that [3][m) is the arithmetic average of all p[i][m] for a[i] - J and mis o or 1, similar to what you did in Lab #1. The function returns the sum of squared distances. Implement this function in a different file (says, yy.c). Make another main program (says, main2.c) that call xx(), yy(), and xx() in sequence and print its results as sketched below: int main() e = xx(x, a, n, c, k); e = y (x, a, n, c, k); e - xx(x, a, n, C, k); // print x and a To compile and link the program, you will execute compile commands like $ gcc -c main2.c $ gcc -c yy.c $ gcc main2.0 xx.0 yy.o -o prog2 While developing a program, you can compile only modified source code but must link with all related object files to build an executable program. Does the second program make a different result from the first program? Use the gnuplot to draw xy-chart with labels for each result and find out the difference. What kind of outcome you would obtain if you repeat those two functions more time