

Answered step by step
Verified Expert Solution
Question
1 Approved Answer
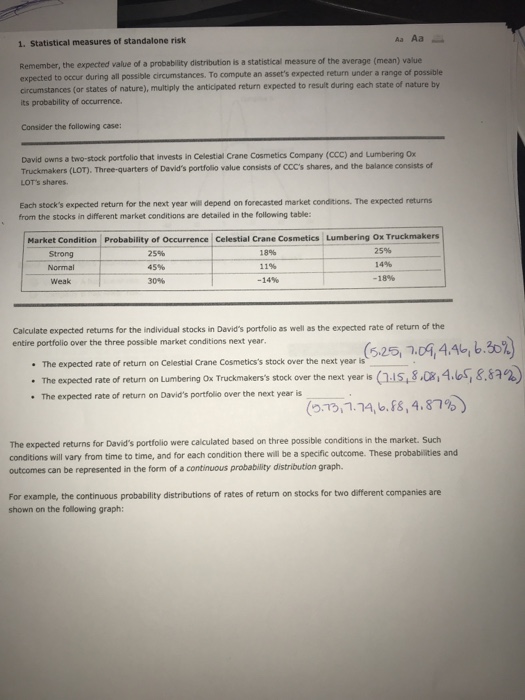
1. Statistical measures of standalone risk Remember, the expected value of a probablity distribution is a statistical messure of the average (mean) value expected to
Step by Step Solution
There are 3 Steps involved in it
Step: 1

Get Instant Access to Expert-Tailored Solutions
See step-by-step solutions with expert insights and AI powered tools for academic success
Step: 2

Step: 3
Ace Your Homework with AI
Get the answers you need in no time with our AI-driven, step-by-step assistance
Get Started
Financial Markets and Institutions
Authors: Frederic S. Mishkin, Stanley G. Eakins
8th edition
013342362X, 978-0133423624