1.
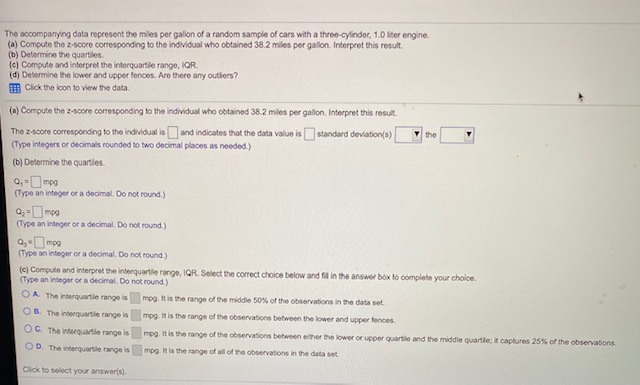
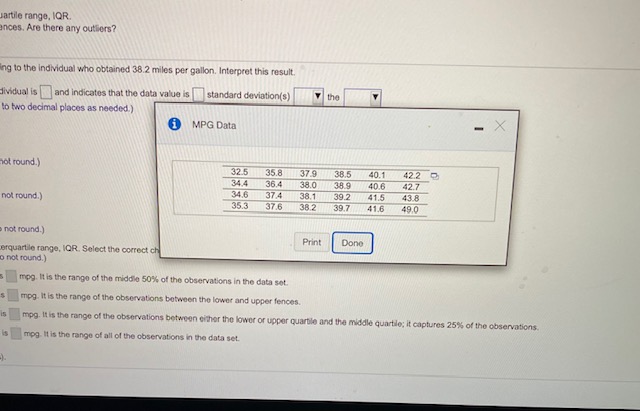
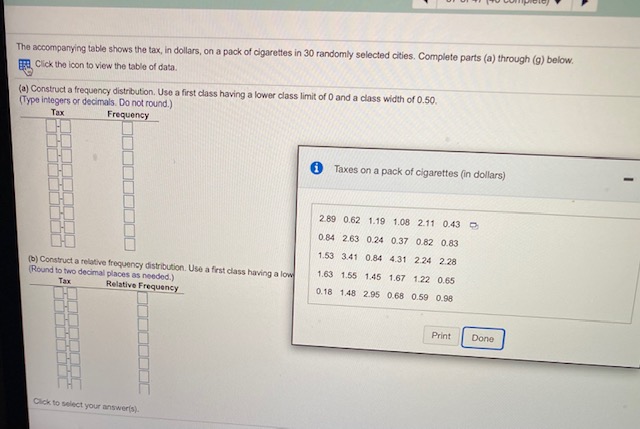
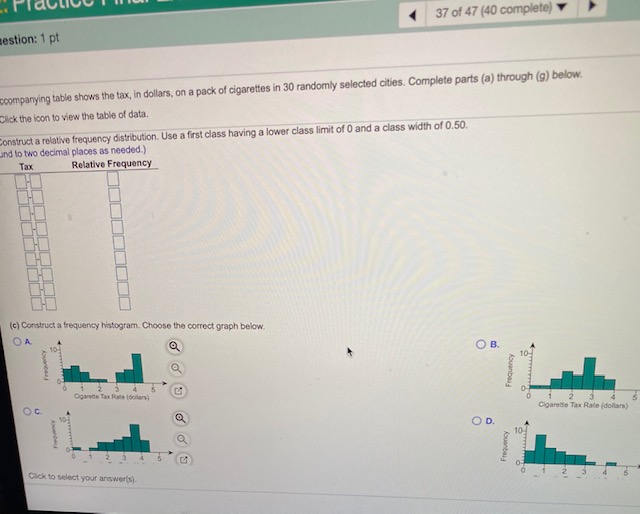
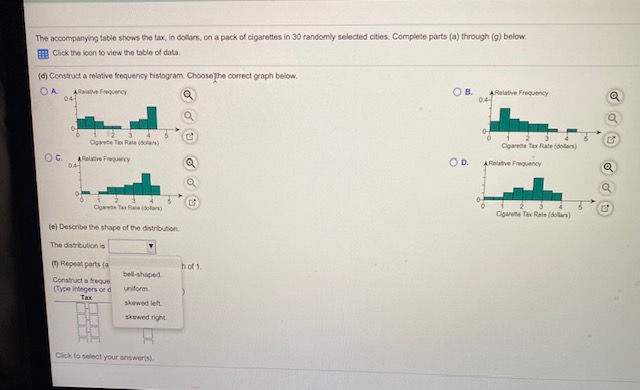
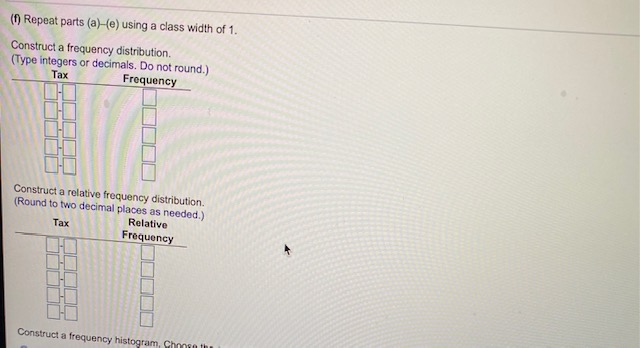
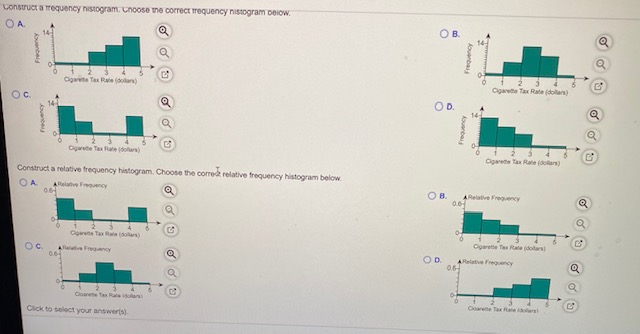
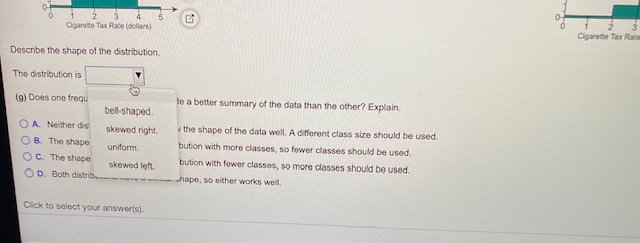
The accompanying data represent the miles per gallon of a random sample of cars with a three-cylinder, 1.0 Ster engine. (a) Compute the z-score corresponding to the individual who obtained 38.2 miles per gallon. Interpret this result. (b) Determine the quartiles. (:] Compute and interpret the interquartile range, IOR. (d) Determine the lower and upper fences. Are there any outliers? if Click the Icon to view the data. (a) Compute the z-score corresponding to the individual who obtained 38.2 miles per gallon. Interpret this result. The z-scare corresponding to the Individual is and indicates that the data value is ] standard deviation(s) the (Type integers or decimals rounded to two decimal places as needed.) (b] Deforming the quartiles. 01 =mpg (Typo an integer or a decimal, Do not round.) (Type an integer of a decimal, Do not round.) [Type an Integer or a decimal. Do not round.) (c) Compuin and Interpret the interquartile range, IOft. Select the correct choice below and fil in the answer box to complete your choice. (Type on Intoger or a decimal. Do not round.) O A The inferquartile range is mog. It is the range of the middle 50%% of the observations In the data set. O B. The interquartile range is mog It is the range of the observations between the lower and upper fences. O G. The Inquirsio range is mop. It is the range of the observations between elter the lower or upper quartile and the middle quartile; It captures 28%% of the observations. O D. The interquartile range is mog. it is the range of all of the observations in the data set. Click to select your answerls).artile range, IOR. ances. Are there any outhers? ing to the Individual who obtained 38.2 miles per gallon. Interpret this result. dividual is |and indicates that the data value is |standard deviation(s) the to two decimal places as needed.) i MPG Data - X hot round.) 32 5 35.8 37.9 38.5 40.1 42.2 0 34.4 36.4 38.0 39.9 40.6 42.7 not round.) 34.6 37.4 38.1 39.2 41.5 43.8 35.3 37.6 38 2 39.7 41.6 49.0 not round.) Print Done orquartile range, IOR. Select the correct ch a not round.) mop. It is the range of the middle 50%% of the observations in the data set. mpeg. It is the range of the observations between the lower and upper fences. mag. like the range of the observations between either the lower or upper quartile and the middle quartile; it captures 25% of the observations. mpeg. it is the range of all of the observations in the data set.The accompanying table shows the tax, In dollars, on a pack of cigarettes in 30 randomly selected cities. Complete parts (a) through (g) below. Cick the Icon to view the table of data. (a] Construct a frequency distribution. Use a first class having a lower class limit of 0 and a class width of 0.50 (Type integers or decimals. Do not round.) Tax Frequency Taxes on a pack of cigarettes (in dollars) 269 0.62 1.19 1.08 2.11 0.43 2 0.84 2.63 0.24 0.37 0.82 0.83 1.53 3.41 0.84 4.31 2.24 2.28 (b) Construct a relative froquincy distribution. Use a first class having a low 1.63 1.55 1.45 1.67 1.22 0.65 (Round to two decimal places as needed.) Relative Frequency 0.18 148 2.95 0.68 0.59 0.98 Print Done Click to select your answeris!.37 of 47 (40 complete) estion: 1 pt scompanying table shows the tax, in dollars, on a pack of cigarettes in 30 randomly selected cities. Complete parts (a) through (g) below. Click the icon to view the table of data. construct a relative frequency distribution. Use a first class having a lower class limit of 0 and a class width of 0.50. and to two decimal places as needed.) Tax Relative Frequency O (c) Construct a frequency histogram. Choose the correct graph below. OA OB Frequency 4 Oparere Tax Rate (dolar) 2 3 OG Coareto Tax Rate (dollar) OD. 10 Finquincy 23 4 P. Click to select your answers). 3 5The accompanying table shows the tax, In dollars, on a pack of cigarettes in 30 randomly selected cities. Complete parts (a) through (g) below. ETH Click the Icon to view the table of data. () Construct a relative froquency histogram. Choose the correct graph below. OA O B. 0.4- OG. A Polodis Froquincy OD. 2 (e] Describe the shape of the distribution. The durbution is In Report parts (1 h of 1. bol-shaped Construct s Meque ITyp Intogon. or d un dom at moved right Click to select your answertil(f) Repeat parts (a)-(e) using a class width of 1. Construct a frequency distribution. (Type integers or decimals. Do not round.) Tax Frequency Construct a relative frequency distribution. (Round to two decimal places as needed.) Tax Relative Frequency Construct a frequency histogram, ChongnConstruct a frequency nivogram. whooso me correct frequency nitogram DOlow. OB 2 Open Tax Rate (dolan) Qpure Tax Rate (solan) OC OD. Construct a relative frequency histogram. Choose the correct relative frequency histogram below. OA CH 1 2 Click to select your answeris].2 4 Cigarette Tax Rate (dollars) Describe the shape of the distribution. The distribution is (g) Does one frequ le a better summary of the data than the other? Explain. bel-shaped O A. Neither dis skewed right the shape of the data well, A different class size should be used. O B. The shape uniform. bution with more classes, so fower classes should be used. O G. The shape skewed loft bution with fowor classes, so more classes should be used. chapo. so either works well. Click to select your answer(s)
