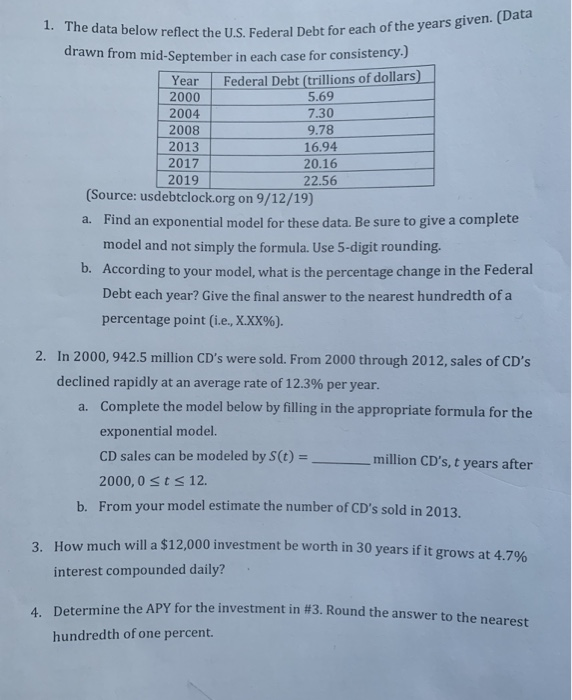
1. The data below reflect the U.S. Federal Debt for each of the years given. (Data drawn from mid-September in each case for consistency. Federal Debt (trillions of dollars) 5.69 Year 2000 2004 7.30 9.78 2008 2013 2017 16.94 20.16 2019 22.56 (Source: usdebtclock.org on 9/12/19) Find an exponential model for these data. Be sure to give a complete a. model and not simply the formula. Use 5-digit rounding b. According to your model, what is the percentage change in the Federal Debt each year? Give the final answer to the nearest hundred th of a percentage point (i.e., X.XX%). 2. In 2000, 942.5 million CD's were sold. From 2000 through 2012, sales of CD's declined rapidly at an average rate of 12.3% per year. Complete the model below by filling in the appropriate formula for the a. exponential model. CD sales can be modeled by S(t) = . million CD's, t years after 2000,0 ts 12 b. From your model estimate the number of CD's sold in 2013. 3. How much will a $12,000 investmentbe worth in 30 years if it grows at 4.7 % interest compounded daily? 4. Determine the APY for the investment in #3. Round the answer to the nearest hundredth of one percent. 1. The data below reflect the U.S. Federal Debt for each of the years given. (Data drawn from mid-September in each case for consistency. Federal Debt (trillions of dollars) 5.69 Year 2000 2004 7.30 9.78 2008 2013 2017 16.94 20.16 2019 22.56 (Source: usdebtclock.org on 9/12/19) Find an exponential model for these data. Be sure to give a complete a. model and not simply the formula. Use 5-digit rounding b. According to your model, what is the percentage change in the Federal Debt each year? Give the final answer to the nearest hundred th of a percentage point (i.e., X.XX%). 2. In 2000, 942.5 million CD's were sold. From 2000 through 2012, sales of CD's declined rapidly at an average rate of 12.3% per year. Complete the model below by filling in the appropriate formula for the a. exponential model. CD sales can be modeled by S(t) = . million CD's, t years after 2000,0 ts 12 b. From your model estimate the number of CD's sold in 2013. 3. How much will a $12,000 investmentbe worth in 30 years if it grows at 4.7 % interest compounded daily? 4. Determine the APY for the investment in #3. Round the answer to the nearest hundredth of one percent


