Answered step by step
Verified Expert Solution
Link Copied!

Question

1 Approved Answer

1. The data below shows the result of an experiment testing the insulation effect of a gas (SE3). In the experiment a gaseous insulation was
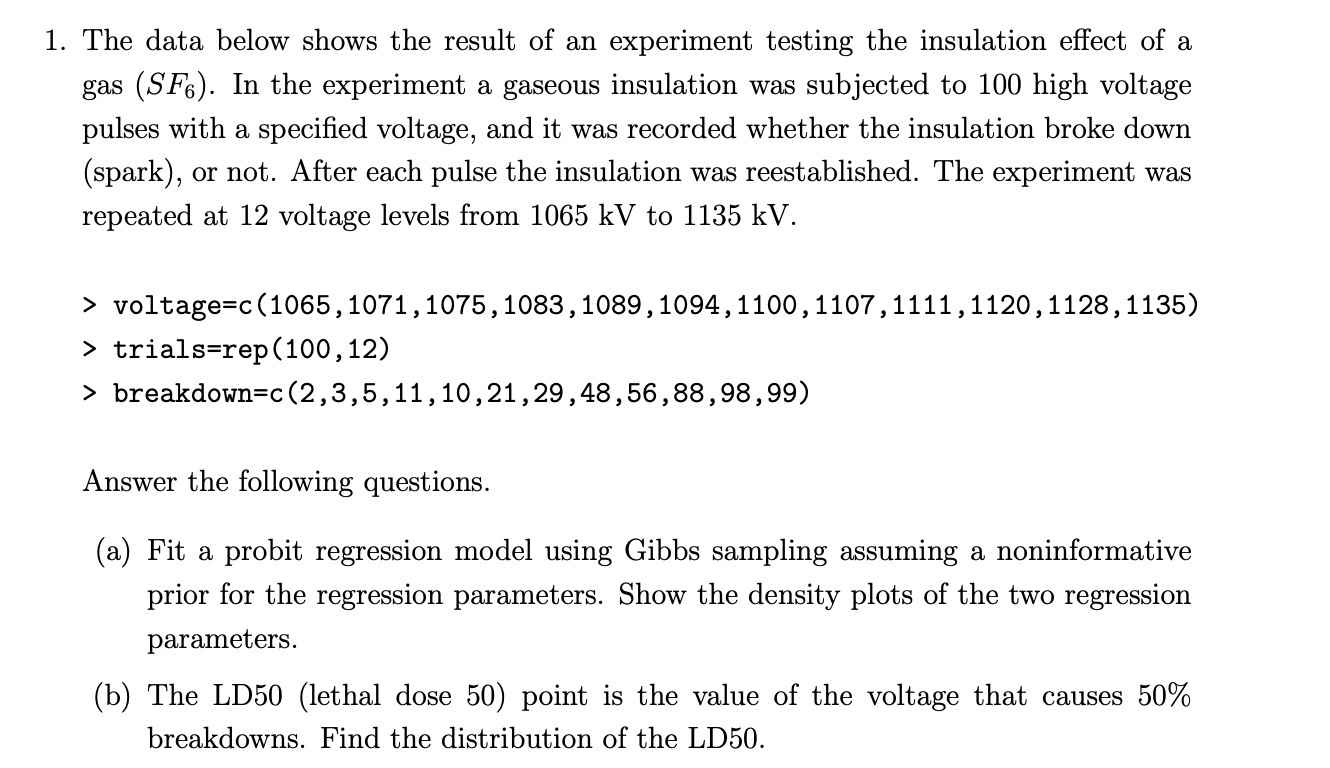
image text in transcribed
1. The data below shows the result of an experiment testing the insulation effect of a gas (SE3). In the experiment a gaseous insulation was subjected to 100 high voltage pulses with a specied voltage, and it was recorded whether the insulation broke down (spark), or not. After each pulse the insulation was reestablished. The experiment was repeated at 12 voltage levels from 1065 kV to 1135 kV. > voltage=c(1065,1071 , 1075, 1083, 1089,1094,1100, 1107, 1111 , 1120,1128,1135) > trials=rep(100,12) > breakdown=c(2,3,5,11,10,21,29,48,56,88,98,99) Answer the following questions. (a) Fit a probit regression model using Gibbs sampling assuming a noninformative prior for the regression parameters. Show the density plots of the two regression parameters. (b) The LD50 (lethal dose 50) point is the value of the voltage that causes 50% breakdowns. Find the distribution of the LD50

Step by Step Solution

There are 3 Steps involved in it

Step: 1

blur-text-image

Get Instant Access to Expert-Tailored Solutions

See step-by-step solutions with expert insights and AI powered tools for academic success

Step: 2

blur-text-image

Step: 3

blur-text-image

Ace Your Homework with AI

Get the answers you need in no time with our AI-driven, step-by-step assistance

Get Started

Recommended Textbook for

Precalculus Enhanced With Graphing Utilities (Subscription)

Authors: Michael, Michael Sullivan III, Michael III Sullivan, III Sullivan

6th Edition

0321849108, 9780321849106

More Books

Students also viewed these Mathematics questions