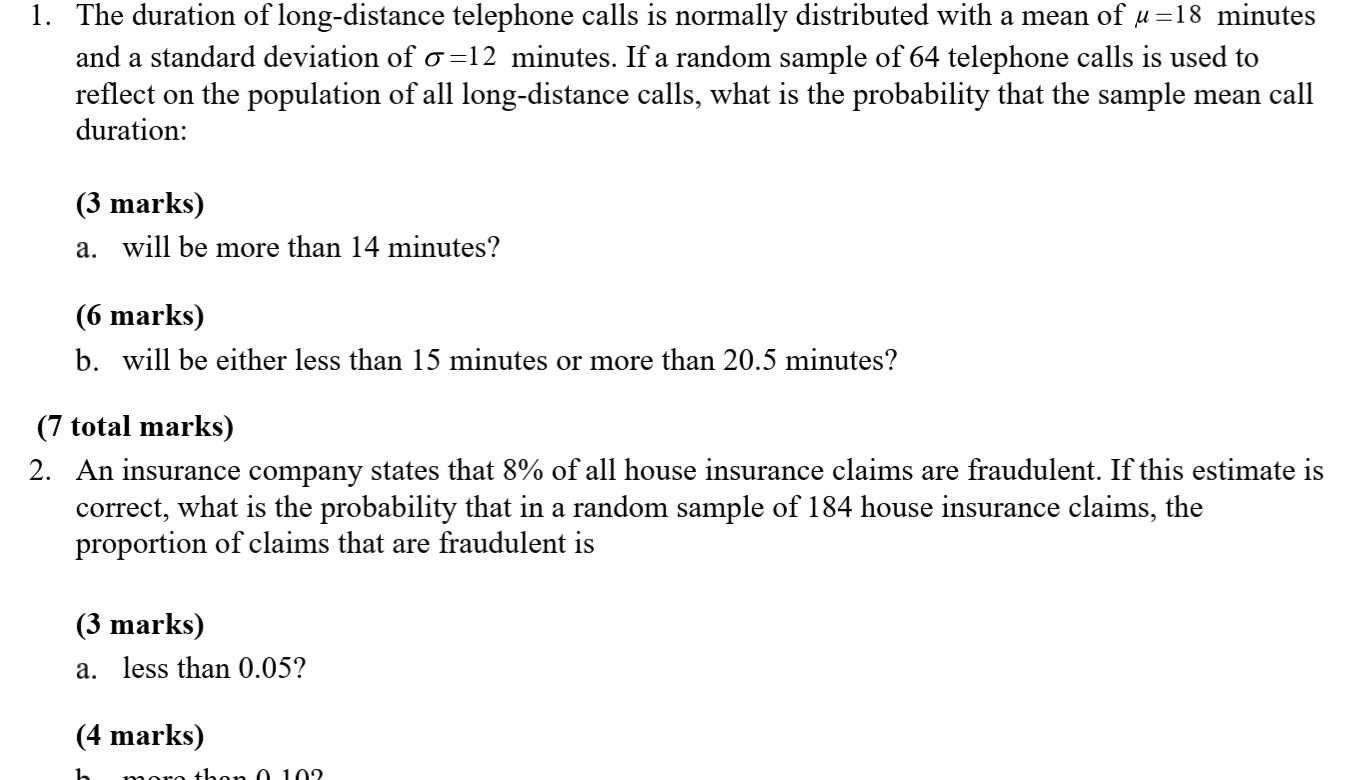
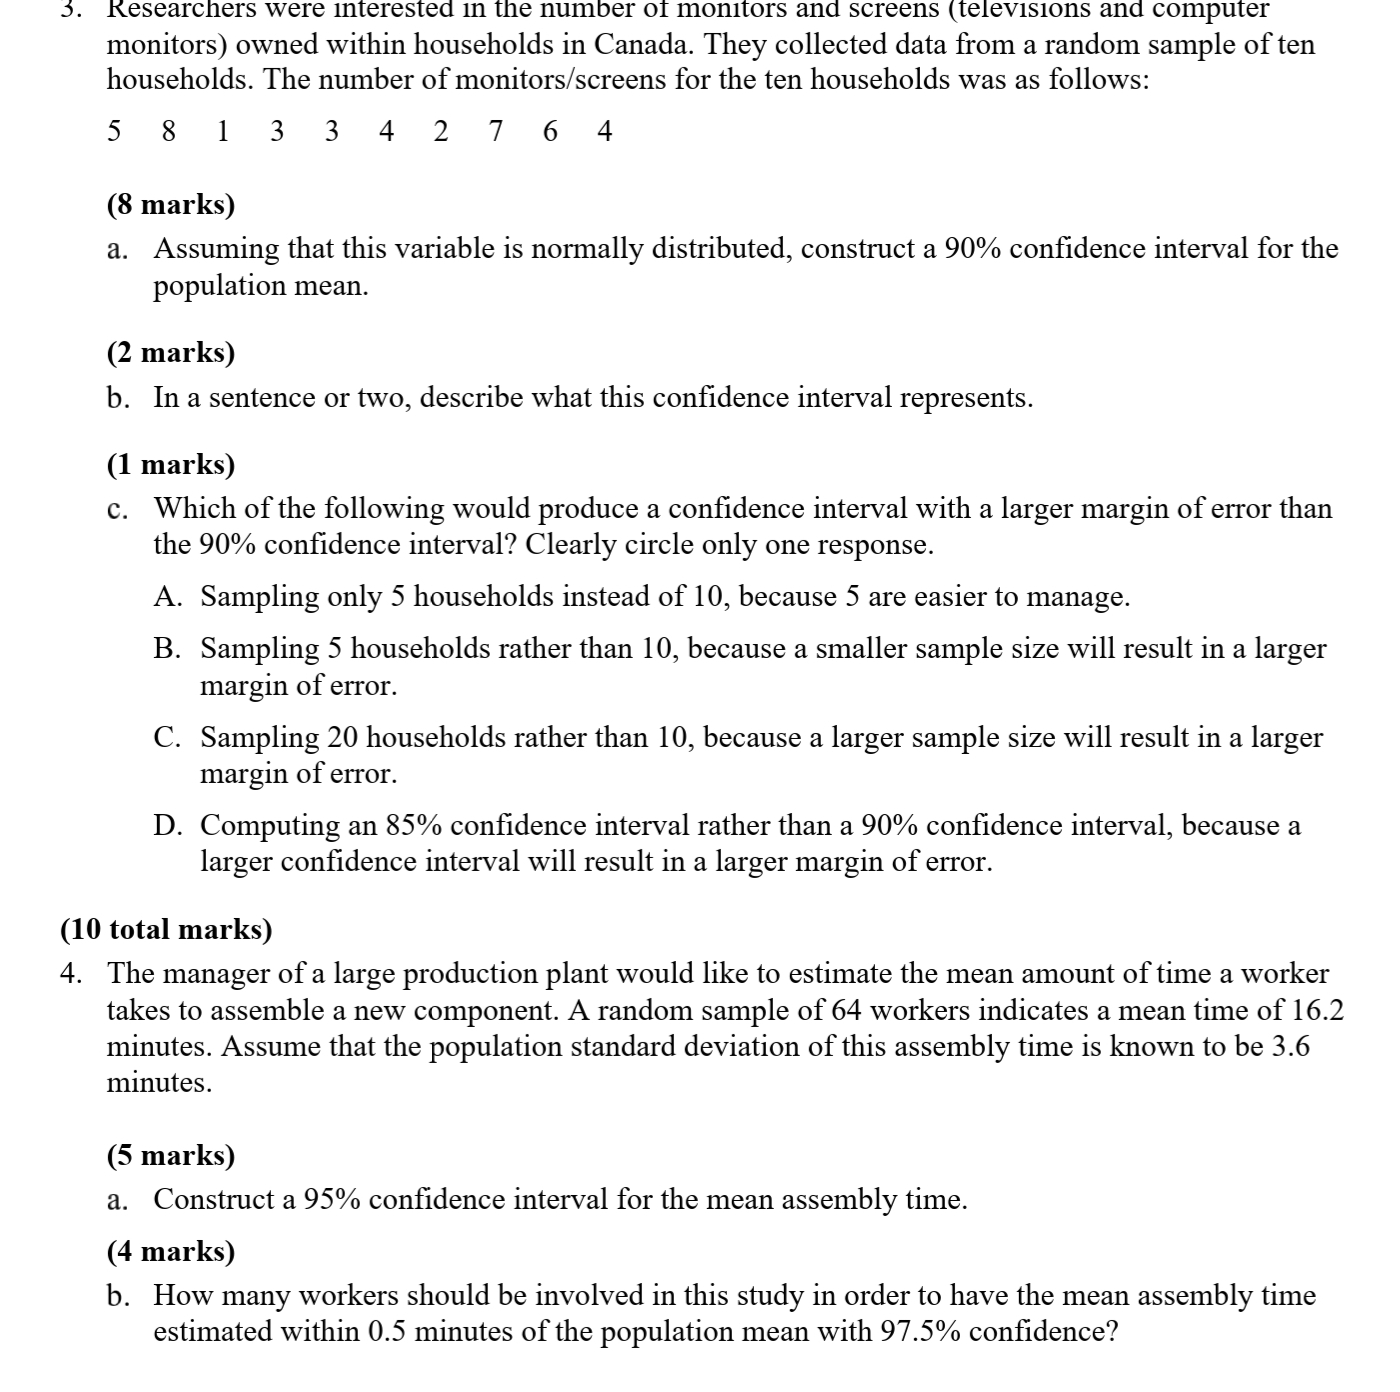
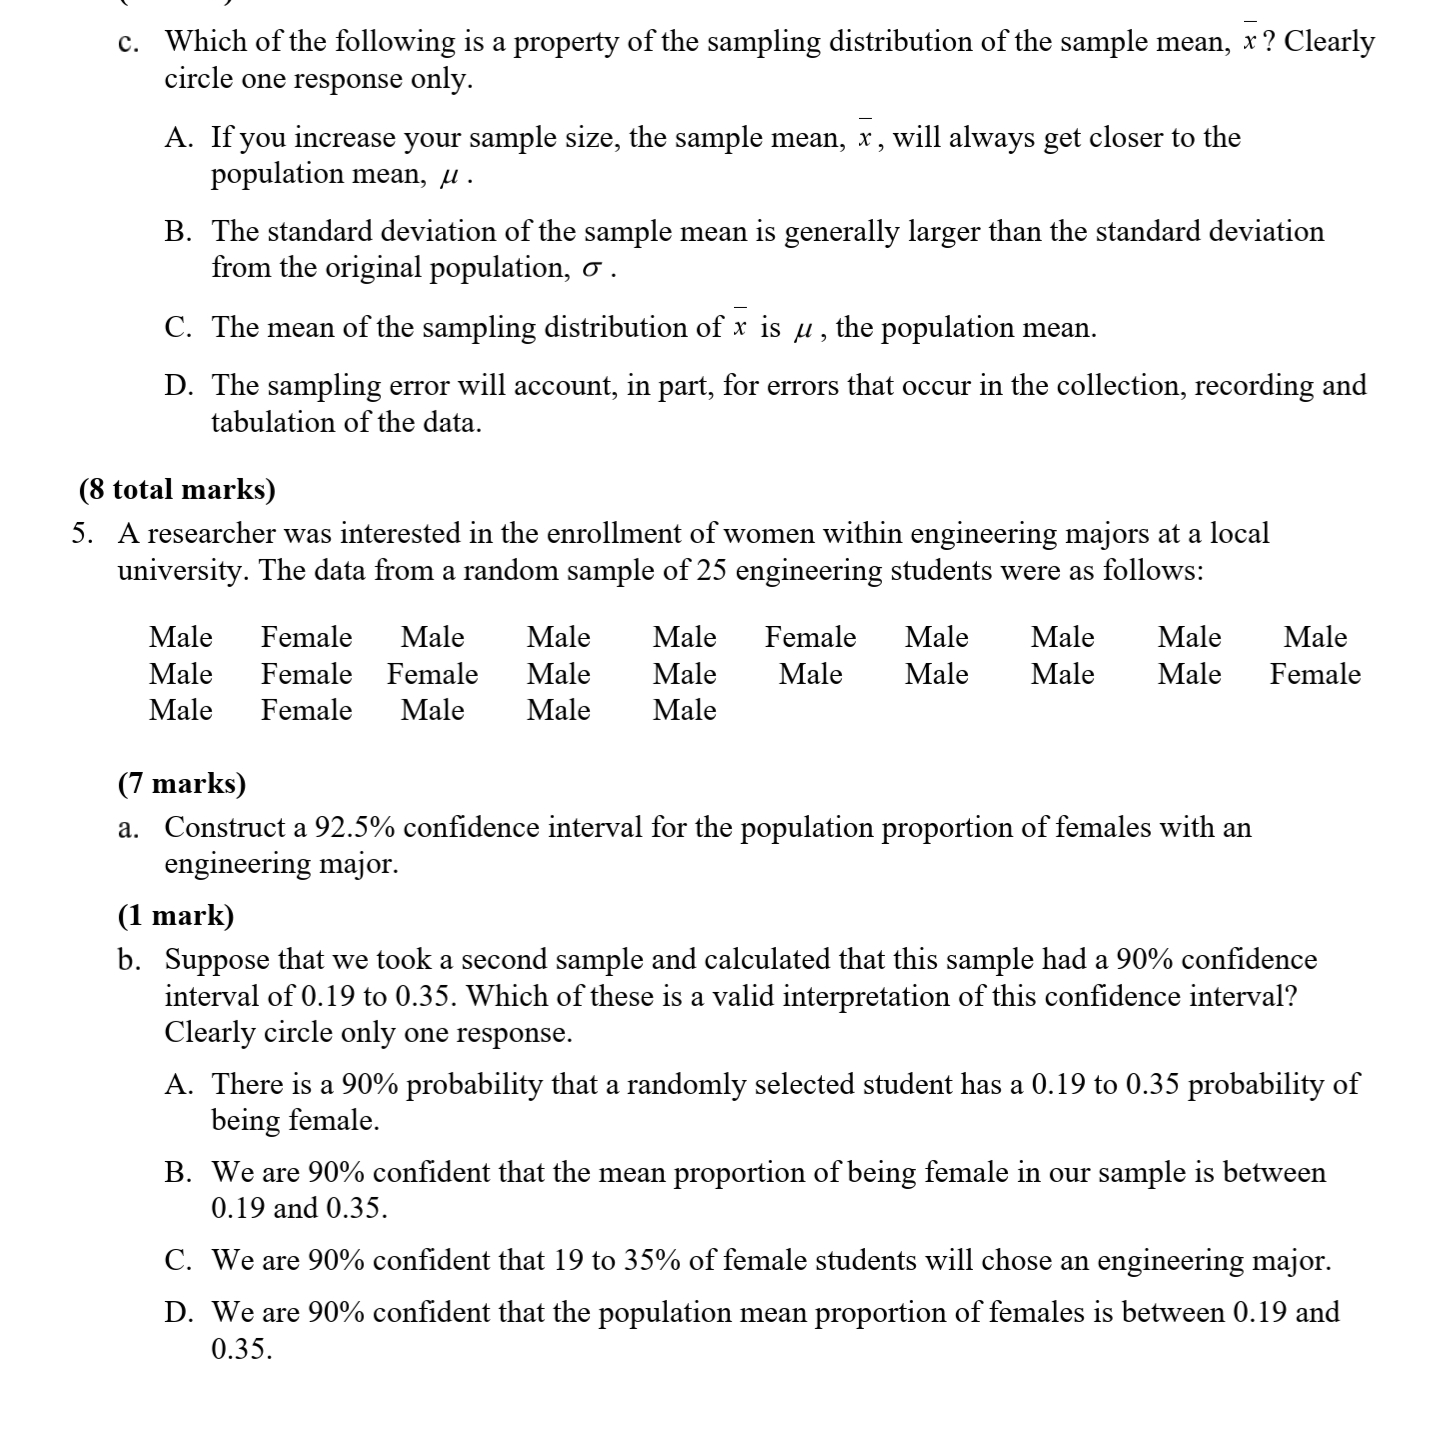
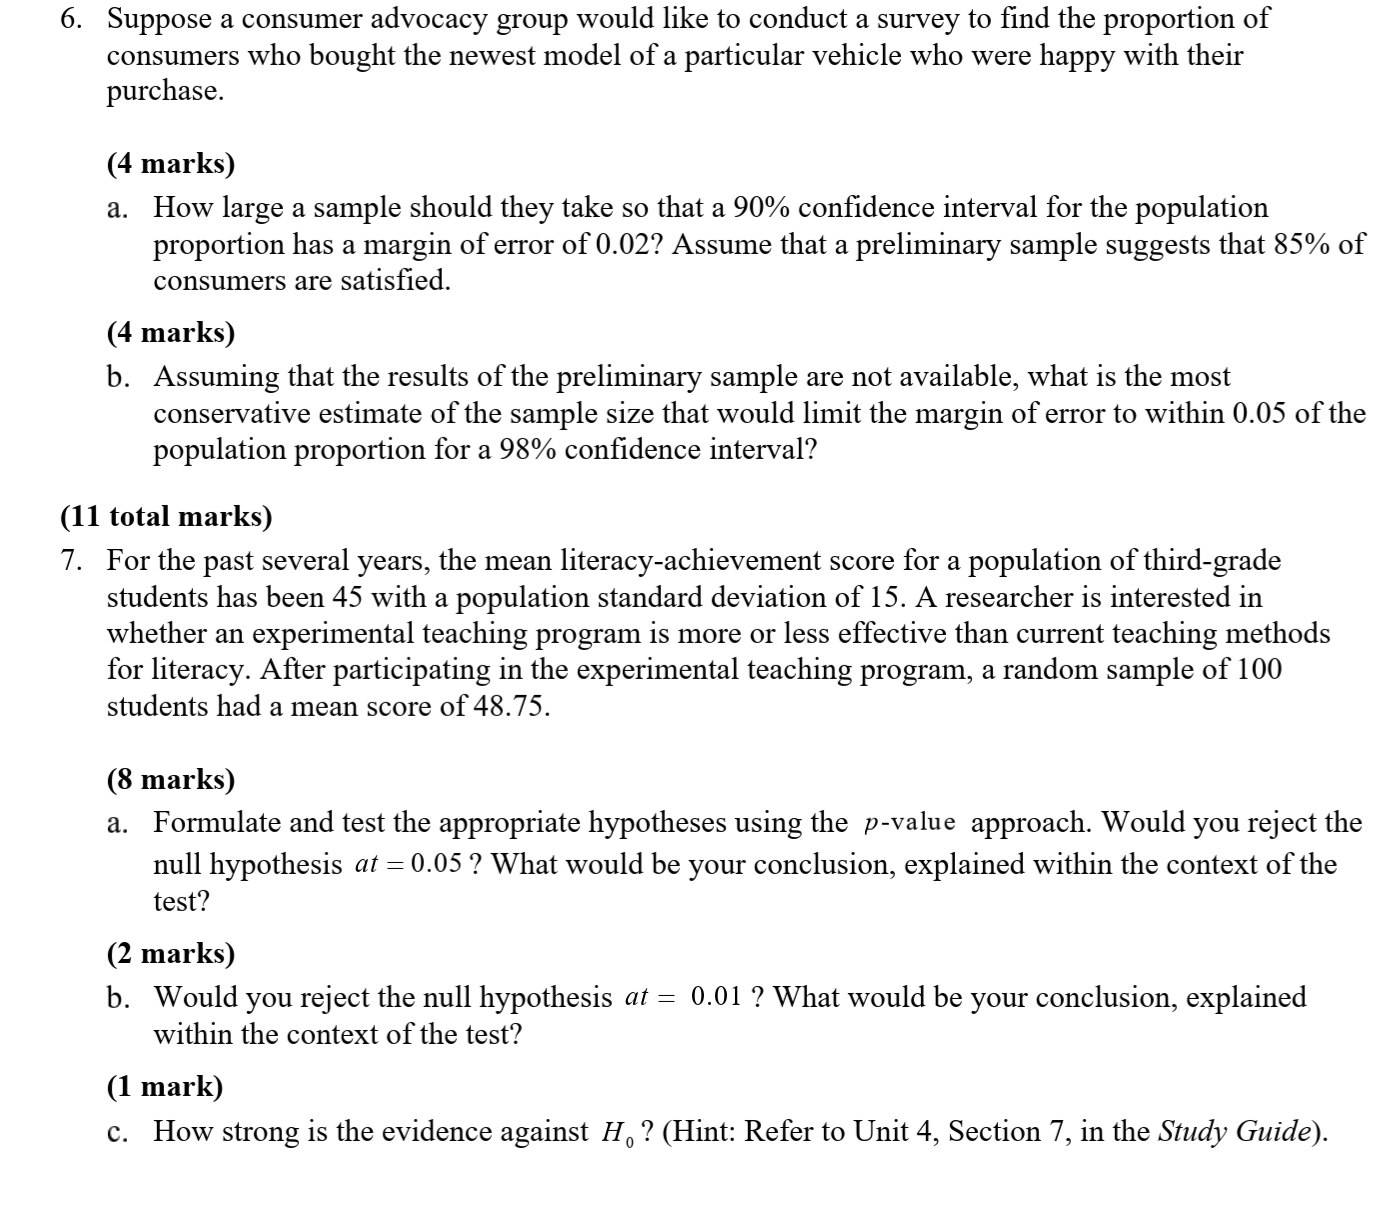
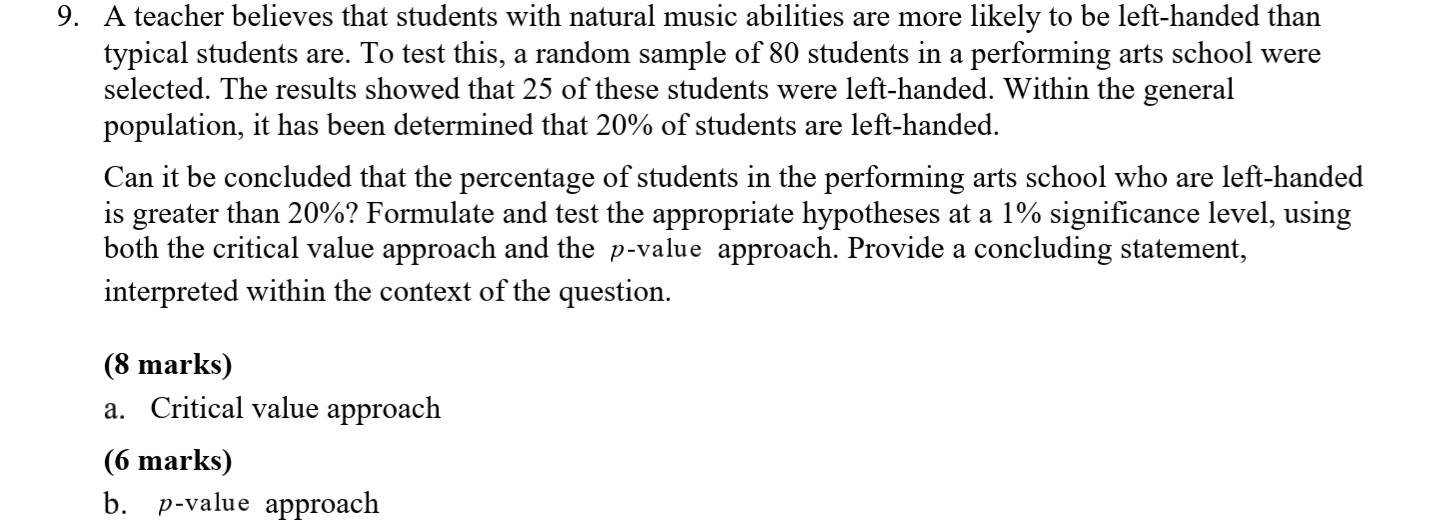
1. The duration of long-distance telephone calls is normally distributed with a mean of u =18 minutes and a standard deviation of o =12 minutes. If a random sample of 64 telephone calls is used to reflect on the population of all long-distance calls, what is the probability that the sample mean call duration: (3 marks) a. will be more than 14 minutes? (6 marks) b. will be either less than 15 minutes or more than 20.5 minutes? (7 total marks) 2. An insurance company states that 8% of all house insurance claims are fraudulent. If this estimate is correct, what is the probability that in a random sample of 184 house insurance claims, the proportion of claims that are fraudulent is (3 marks) a. less than 0.05? (4 marks)3. Researchers were interested in the number of monitors and screens (televisions and computer monitors) owned within households in Canada. They collected data from a random sample of ten households. The number of monitors/screens for the ten households was as follows: 5 8 1 3 3 4 2 7 6 4 (8 marks) a. Assuming that this variable is normally distributed, construct a 90% confidence interval for the population mean. (2 marks) b. In a sentence or two, describe what this confidence interval represents. (1 marks) c. Which of the following would produce a confidence interval with a larger margin of error than the 90% confidence interval? Clearly circle only one response. A. Sampling only 5 households instead of 10, because 5 are easier to manage. B. Sampling 5 households rather than 10, because a smaller sample size will result in a larger margin of error. C. Sampling 20 households rather than 10, because a larger sample size will result in a larger margin of error. D. Computing an 85% confidence interval rather than a 90% confidence interval, because a larger confidence interval will result in a larger margin of error. (10 total marks) 4. The manager of a large production plant would like to estimate the mean amount of time a worker takes to assemble a new component. A random sample of 64 workers indicates a mean time of 16.2 minutes. Assume that the population standard deviation of this assembly time is known to be 3.6 minutes. (5 marks) a. Construct a 95% confidence interval for the mean assembly time. (4 marks) b. How many workers should be involved in this study in order to have the mean assembly time estimated within 0.5 minutes of the population mean with 97.5% confidence?\\ 1 c. Which of the following is a property of the sampling distribution of the sample mean, E? Clearly circle one response only. A. If you increase your sample size, the sample mean, Q, will always get closer to the population mean, ,2 . B. The standard deviation of the sample mean is generally larger than the standard deviation from the original population, 0' . C. The mean of the sampling distribution of E is p , the population mean. D. The sampling error will account, in part, for errors that occur in the collection, recording and tabulation of the data. (8 total marks) 5. A researcher was interested in the enrollment of women within engineering majors at a local university. The data from a random sample of 25 engineering students were as follows: Male Female Male Male Male Female Male Male Male Male Male Female Female Male Male Male Male Male Male Female Male Female Male Male Male (7 marks) a. Construct a 92.5% condence interval for the population proportion of females with an engineering major. (1 mark) b. Suppose that we took a second sample and calculated that this sample had a 90% condence interval of 0.19 to 0.35. Which of these is a valid interpretation of this condence interval? Clearly circle only one response. A. There is a 90% probability that a randomly selected student has a 0.19 to 0.35 probability of being female. B. We are 90% condent that the mean proportion of being female in our sample is between 0.19 and 0.35. We are 90% condent that 19 to 35% of female students will chose an engineering major. .0 D. We are 90% condent that the population mean proportion of females is between 0.19 and 0.35. 6. Suppose a consumer advocacy group would like to conduct a survey to nd the proportion of consumers who bought the newest model of a particular vehicle who were happy with their purchase. (4 marks) a. How large a sample should they take so that a 90% condence interval for the population proportion has a margin of error of 0.02? Assume that a preliminary sample suggests that 85% of consumers are satised. (4 marks) b. Assuming that the results of the preliminary sample are not available, what is the most conservative estimate of the sample size that would limit the margin of error to within 0.05 of the population proportion for a 98% condence interval? (11 total marks) 7. For the past several years, the mean literacy-achievement score for a population of thirdgrade students has been 45 with a population standard deviation of 15. A researcher is interested in whether an experimental teaching program is more or less effective than current teaching methods for literacy. After participating in the experimental teaching program, a random sample of 100 students had a mean score of 48.75. (8 marks) a. Formulate and test the appropriate hypotheses using the p-value approach. Would you reject the null hypothesis at : 0.05 ? What would be your conclusion, explained within the context of the test? (2 marks) b. Would you reject the null hypothesis at = 0.01 ? What would be your conclusion, explained within the context of the test? (1 mark) c. How strong is the evidence against H u ? (Hint: Refer to Unit 4, Section 7, in the Study Guide). 9. A teacher believes that students with natural music abilities are more likely to be left-handed than typical students are. To test this, a random sample of 80 students in a performing arts school were selected. The results showed that 25 of these students were left-handed. Within the general population, it has been determined that 20% of students are left-handed. Can it be concluded that the percentage of students in the performing arts school who are lehanded is greater than 20%? Formulate and test the appropriate hypotheses at a 1% signicance level, using both the critical value approach and the p-value approach. Provide a concluding statement, interpreted within the context of the question. (8 marks) a. Critical value approach (6 marks) b_ p-value approach
