Answered step by step
Verified Expert Solution
Question
1 Approved Answer
1. The following results were obtained from particle size distribution analysis of three soils A,B and C. Required: (1) Plot the particle size distribution curves
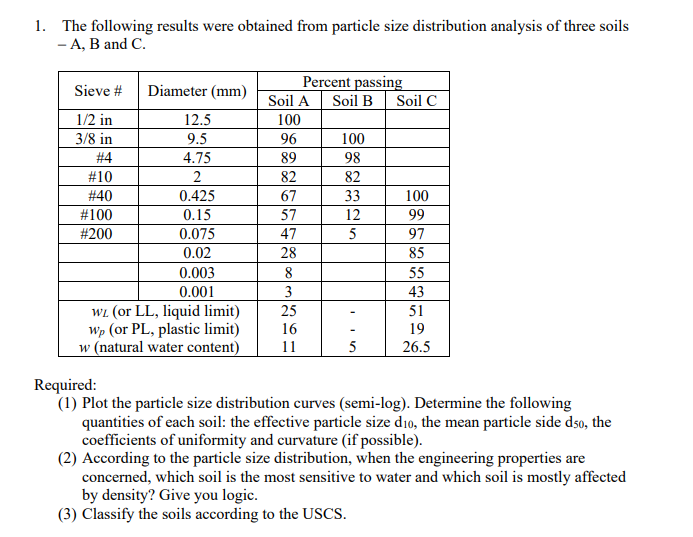
1. The following results were obtained from particle size distribution analysis of three soils A,B and C. Required: (1) Plot the particle size distribution curves (semi-log). Determine the following quantities of each soil: the effective particle size d10, the mean particle side d50, the coefficients of uniformity and curvature (if possible). (2) According to the particle size distribution, when the engineering properties are concerned, which soil is the most sensitive to water and which soil is mostly affected by density? Give you logic. (3) Classify the soils according to the USCS. 1. The following results were obtained from particle size distribution analysis of three soils A,B and C. Required: (1) Plot the particle size distribution curves (semi-log). Determine the following quantities of each soil: the effective particle size d10, the mean particle side d50, the coefficients of uniformity and curvature (if possible). (2) According to the particle size distribution, when the engineering properties are concerned, which soil is the most sensitive to water and which soil is mostly affected by density? Give you logic. (3) Classify the soils according to the USCS
Step by Step Solution
There are 3 Steps involved in it
Step: 1
Get Instant Access to Expert-Tailored Solutions
See step-by-step solutions with expert insights and AI powered tools for academic success
Step: 2
Step: 3
Ace Your Homework with AI
Get the answers you need in no time with our AI-driven, step-by-step assistance
Get Started