

Answered step by step
Verified Expert Solution
Question
1 Approved Answer
1. The following table contains closing monthly stock prices for Oracle Corporation (ORCL), Microsoft Corporation (MSFT), and NVidia (NVDA) for the first half of 2017.
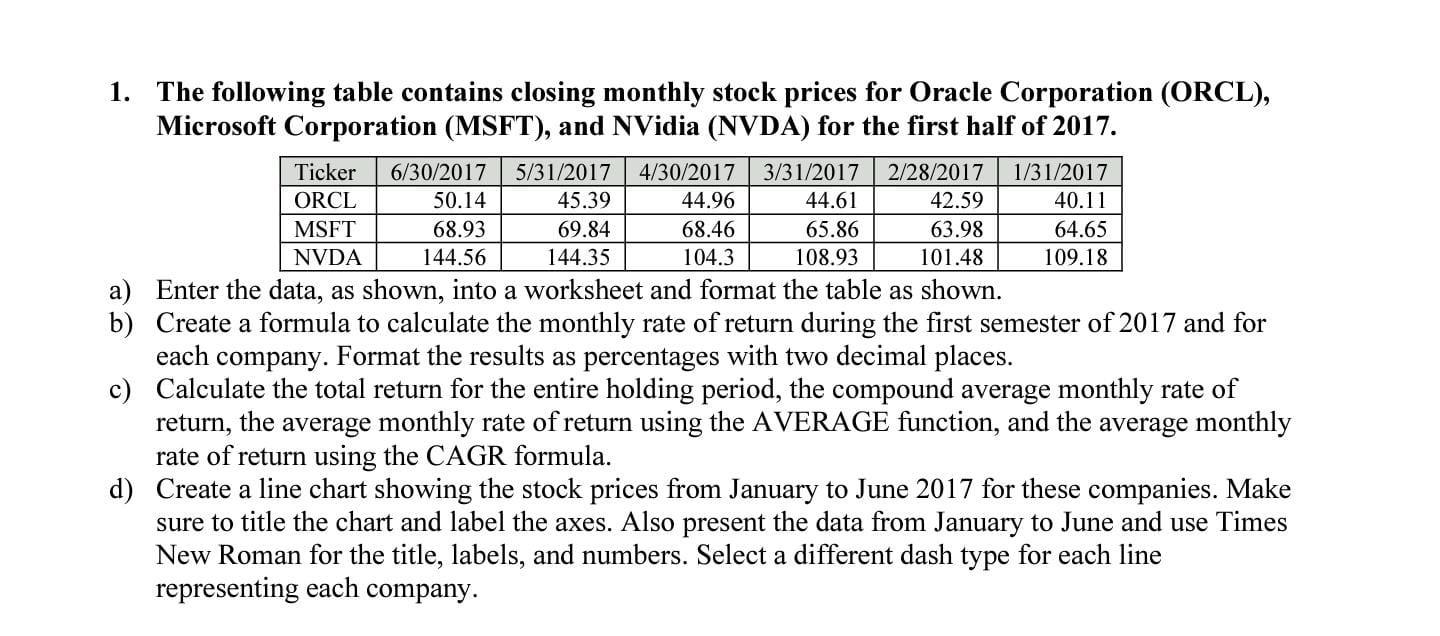
1. The following table contains closing monthly stock prices for Oracle Corporation (ORCL), Microsoft Corporation (MSFT), and NVidia (NVDA) for the first half of 2017. a) Enter the data, as shown, into a worksheet and format the table as shown. b) Create a formula to calculate the monthly rate of return during the first semester of 2017 and for each company. Format the results as percentages with two decimal places. c) Calculate the total return for the entire holding period, the compound average monthly rate of return, the average monthly rate of return using the AVERAGE function, and the average monthly rate of return using the CAGR formula. d) Create a line chart showing the stock prices from January to June 2017 for these companies. Make sure to title the chart and label the axes. Also present the data from January to June and use Times New Roman for the title, labels, and numbers. Select a different dash type for each line representing each company. 1. The following table contains closing monthly stock prices for Oracle Corporation (ORCL), Microsoft Corporation (MSFT), and NVidia (NVDA) for the first half of 2017. a) Enter the data, as shown, into a worksheet and format the table as shown. b) Create a formula to calculate the monthly rate of return during the first semester of 2017 and for each company. Format the results as percentages with two decimal places. c) Calculate the total return for the entire holding period, the compound average monthly rate of return, the average monthly rate of return using the AVERAGE function, and the average monthly rate of return using the CAGR formula. d) Create a line chart showing the stock prices from January to June 2017 for these companies. Make sure to title the chart and label the axes. Also present the data from January to June and use Times New Roman for the title, labels, and numbers. Select a different dash type for each line representing each company
Step by Step Solution
There are 3 Steps involved in it
Step: 1

Get Instant Access to Expert-Tailored Solutions
See step-by-step solutions with expert insights and AI powered tools for academic success
Step: 2

Step: 3
Ace Your Homework with AI
Get the answers you need in no time with our AI-driven, step-by-step assistance
Get Started
Finance And Economics Discussion Series Measurement Error And Time Aggregation A Closer Look At Estimates Of Output Labor Elasticities
Authors: United States Federal Reserve Board, Marcello Estevao
1st Edition
1288722990, 9781288722990