

Answered step by step
Verified Expert Solution
Question
1 Approved Answer
1. The number of cans of soft drinks sold in a machine each week is recorded below. 215, 195, 175, 225, 200, 175, 150, 215,
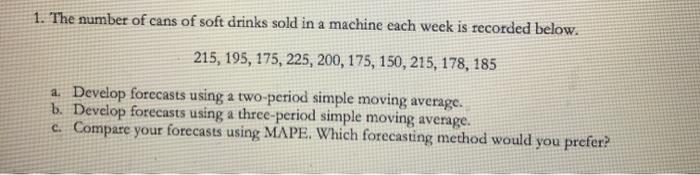
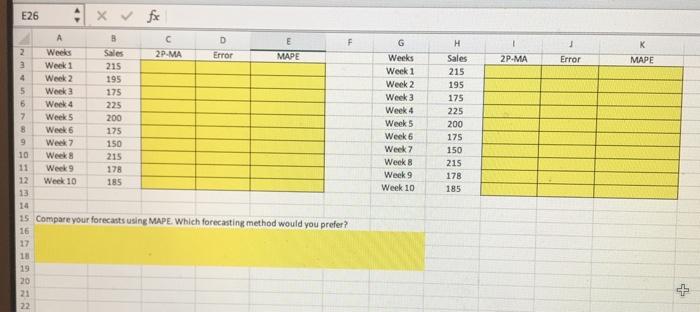 1. The number of cans of soft drinks sold in a machine each week is recorded below. 215, 195, 175, 225, 200, 175, 150, 215, 178, 185 a. Develop forecasts using a two-period simple moving average. b. Develop forecasts using a three-period simple moving average. c. Compare your forecasts using MAPE. Which forecasting method would you prefer? E26 xvf A H K MAPE 2P-MA Error B c D F 2 Weeks Sales 2P-MA Error MAPE Week 1 215 4 Week 2 195 5 Week 175 6 Week 4 225 7 Week 5 200 8 Week 6 175 9 Week 150 10 Weeks 215 11 Week 9 178 12 Week 10 185 13 14 15 Compare your forecasts using MAPE. Which forecasting method would you prefer? G Weeks Week 1 Week 2 Week 3 Week 4 Week 5 Week 6 Week 7 Week 8 Week 9 Week 10 Sales 215 195 175 225 200 175 150 215 178 185 17 18 19 20 21 22
Step by Step Solution
There are 3 Steps involved in it
Step: 1

Get Instant Access with AI-Powered Solutions
See step-by-step solutions with expert insights and AI powered tools for academic success
Step: 2

Step: 3
Ace Your Homework with AI
Get the answers you need in no time with our AI-driven, step-by-step assistance
Get Started