Answered step by step
Verified Expert Solution
Question
1 Approved Answer
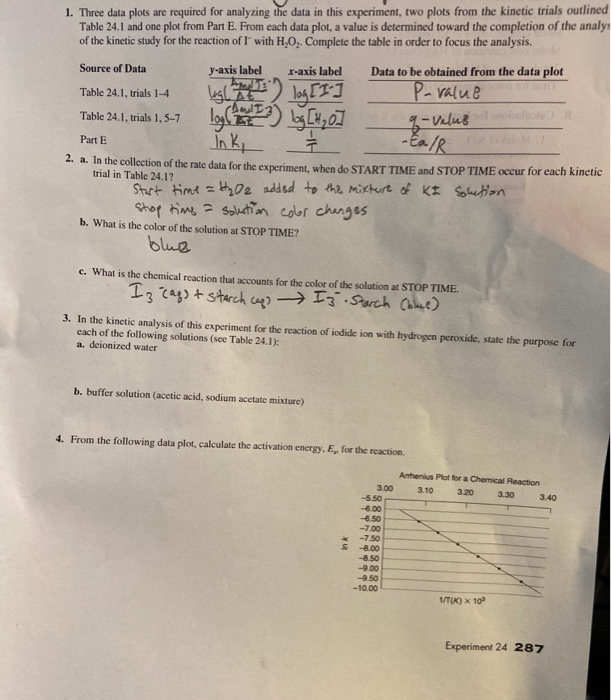
1. Three data plots are required for analyzing the data in this experiment, two plots from the kinetic trials outlined Table 24.1 and one

1. Three data plots are required for analyzing the data in this experiment, two plots from the kinetic trials outlined Table 24.1 and one plot from Part E. From each data plot, a value is determined toward the completion of the analys of the kinetic study for the reaction of I with HO. Complete the table in order to focus the analysis. x-axis label Table 24.1, trials 1-4 log [1] Amal I Table 24.1, trials 1, 5-7 logbog [0] Ink, 7 -Ea/R Part E 2. a. In the collection of the rate data for the experiment, when do START TIME and STOP TIME occur for each kinetic trial in Table 24.1? Start time = H02 added to the mixture of KI Solution stop time = solution color changes Source of Data y-axis label b. What is the color of the solution at STOP TIME? blue c. What is the chemical reaction that accounts for the color of the solution at STOP TIME. I3 (ags + starch ca I3 Starch (blue) Data to be obtained from the data plot los mit sit P-value -valus 3. In the kinetic analysis of this experiment for the reaction of iodide ion with hydrogen peroxide, state the purpose for each of the following solutions (see Table 24.1): a. deionized water b. buffer solution (acetic acid, sodium acetate mixture) 4. From the following data plot, calculate the activation energy, E, for the reaction. S 3.00 -5.50 -6.00 -6.50 -7.00 -7.50 -8.00 -8.50 -9.00 -9.50 -10.00 Anthenius Plot for a Chemical Reaction 3.10 3.20 3.30 1/T(K) x 10 3.40 Experiment 24 287
Step by Step Solution
★★★★★
3.41 Rating (151 Votes )
There are 3 Steps involved in it
Step: 1
Answer 1 Source of Data yaxis label xaxis label Data to be obtained from the data plot Table 241 tri...
Get Instant Access to Expert-Tailored Solutions
See step-by-step solutions with expert insights and AI powered tools for academic success
Step: 2

Step: 3

Ace Your Homework with AI
Get the answers you need in no time with our AI-driven, step-by-step assistance
Get Started


