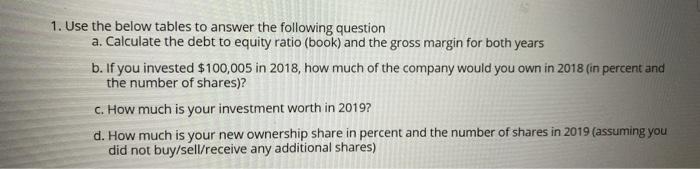
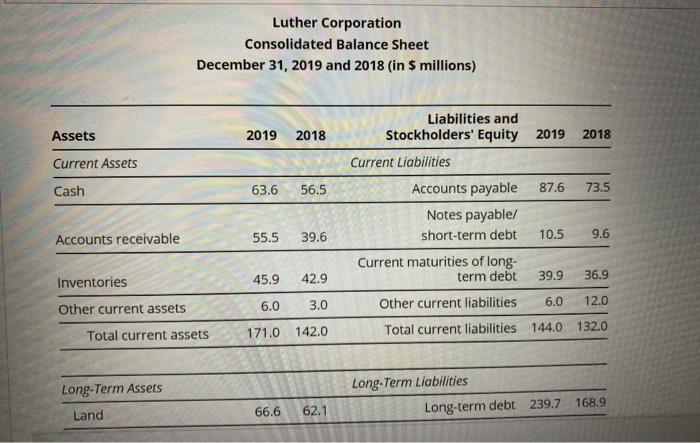
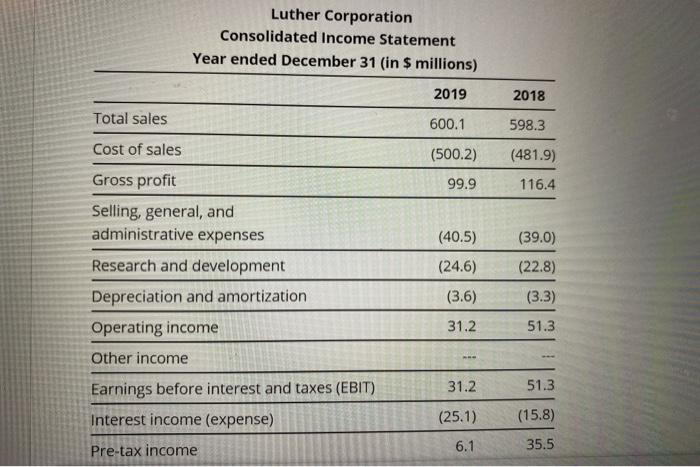
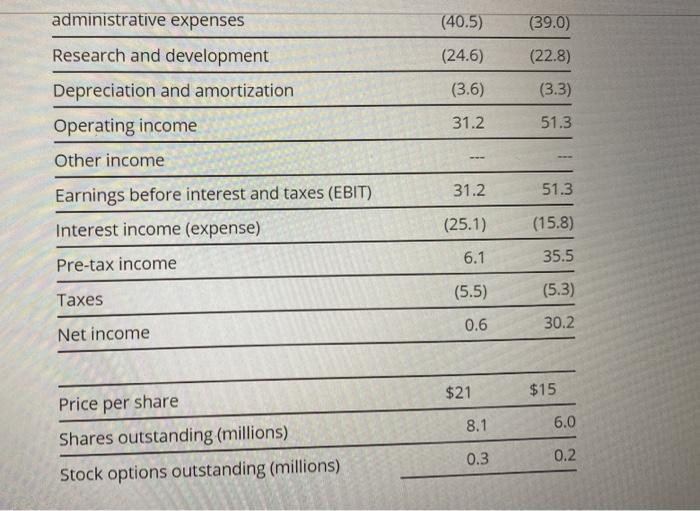
1. Use the below tables to answer the following question a. Calculate the debt to equity ratio (book) and the gross margin for both years b. If you invested $100,005 in 2018, how much of the company would you own in 2018 (in percent and the number of shares)? c. How much is your investment worth in 2019? d. How much is your new ownership share in percent and the number of shares in 2019 (assuming you did not buy/sell/receive any additional shares) Luther Corporation Consolidated Balance Sheet December 31, 2019 and 2018 (in $ millions) Assets 2019 2018 2018 Current Assets Cash 63.6 56.5 73.5 Liabilities and Stockholders' Equity 2019 Current Liabilities Accounts payable 87.6 Notes payable/ short-term debt 10.5 Current maturities of long- term debt 39.9 Other current liabilities 6.0 Total current liabilities 144.0 55.5 Accounts receivable 39.6 9.6 Inventories 45.9 42.9 36.9 6.0 3.0 12.0 Other current assets Total current assets 171.0 142.0 132.0 Long-Term Assets Land Long-Term Liabilities Long-term debt 239.7 168.9 66.6 62.1 Long-Term Assets Land 66.6 62.1 Long-Term Liabilities Long-term debt 239.7 168.9 Capital lease obligations Total Debt 239.7 168.9 109.5 91.5 119.1 99.6 Buildings Equipment Less accumulated depreciation Net property, plant, and equipment (56.1) (52.5) Deferred taxes 22.8 22.2 239.1 200.7 Goodwill 60.0 Other long-term liabilities Total long-term liabilities 262.5 191.1 Total liabilities 406.5 323.1 Stockholders' Equity 126.6 61.6 63.0 Other long-term assets Total long-term assets 42.0 362.1 242.7 Total Assets 533.1 384.7 Total liabilities and Stockholders' Equity 533.1 384.7 Luther Corporation Consolidated Income Statement Year ended December 31 (in $ millions) 2019 2018 Total sales 600.1 598.3 Cost of sales (500.2) (481.9) 99.9 116.4 (40.5) (39.0) (24.6) (22.8) (3.6) (3.3) Gross profit Selling, general, and administrative expenses Research and development Depreciation and amortization Operating income Other income Earnings before interest and taxes (EBIT) Interest income (expense) Pre-tax income 31.2 51.3 31.2 51.3 (25.1) (15.8) 6.1 35.5 (39.0) (40.5) (24.6) (22.8) (3.3) (3.6) administrative expenses Research and development Depreciation and amortization Operating income Other income Earnings before interest and taxes (EBIT) Interest income (expense) 31.2 51.3 31.2 51.3 (25.1) (15.8) 6.1 35.5 Pre-tax income Taxes (5.5) (5.3) 0.6 30.2 Net income $21 $15 8.1 6.0 Price per share Shares outstanding (millions) Stock options outstanding (millions) 0.3 0.2