1. Using information in Exhibits 1, 2 and 4, decide the credit rating for the BHP. The credit rating will have an impact on the interest rates and swap spread. Show the key ratios in one table and the credit rating you have assigned to the BHP.
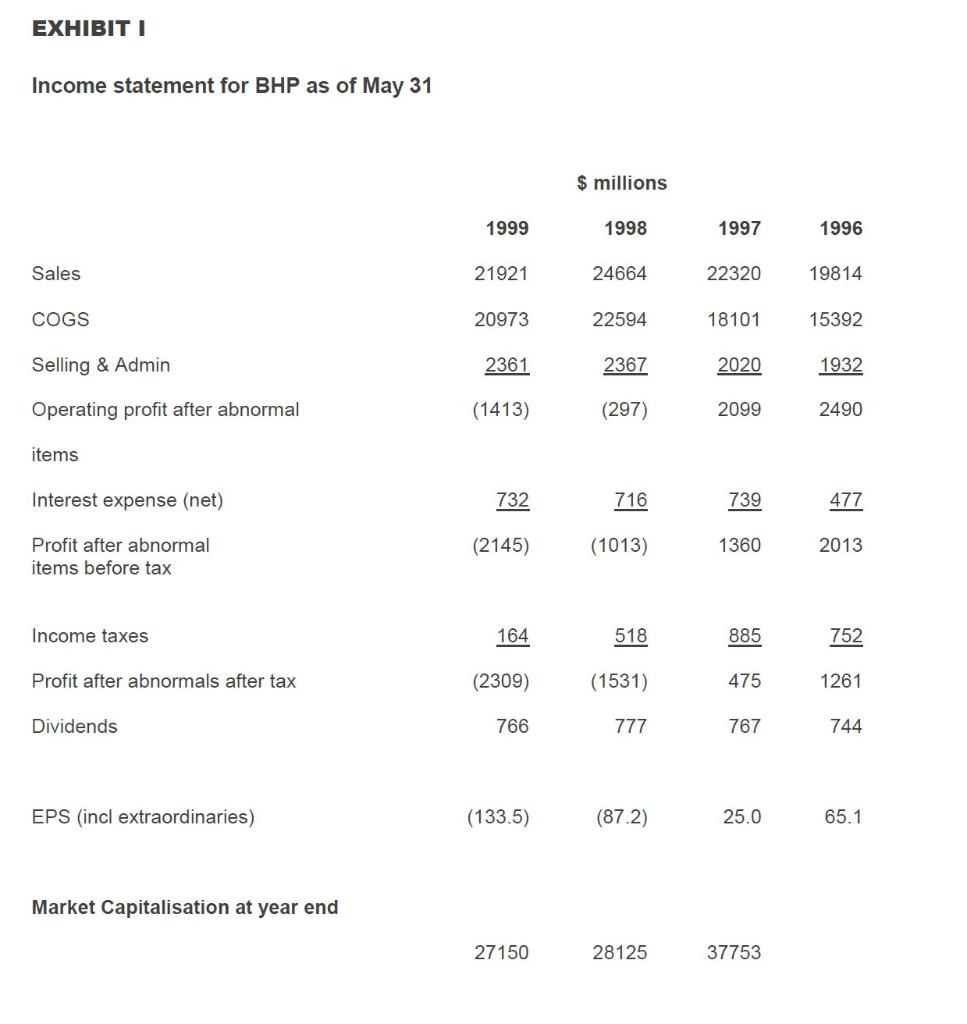
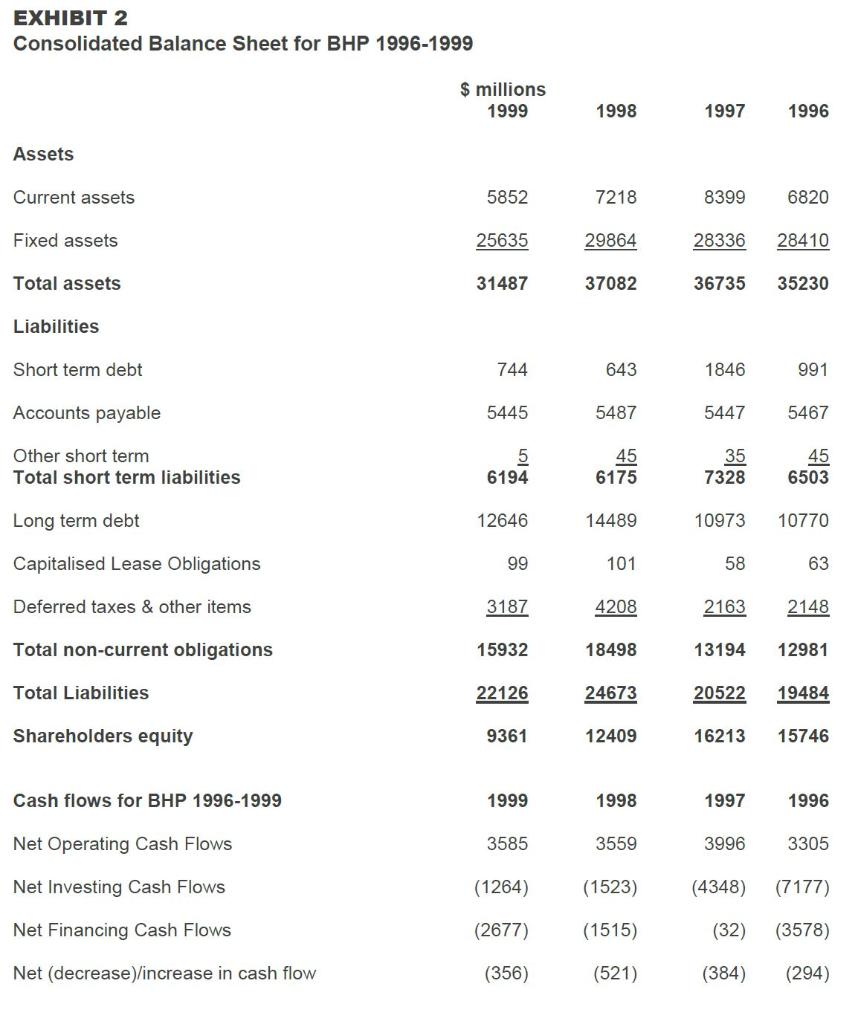
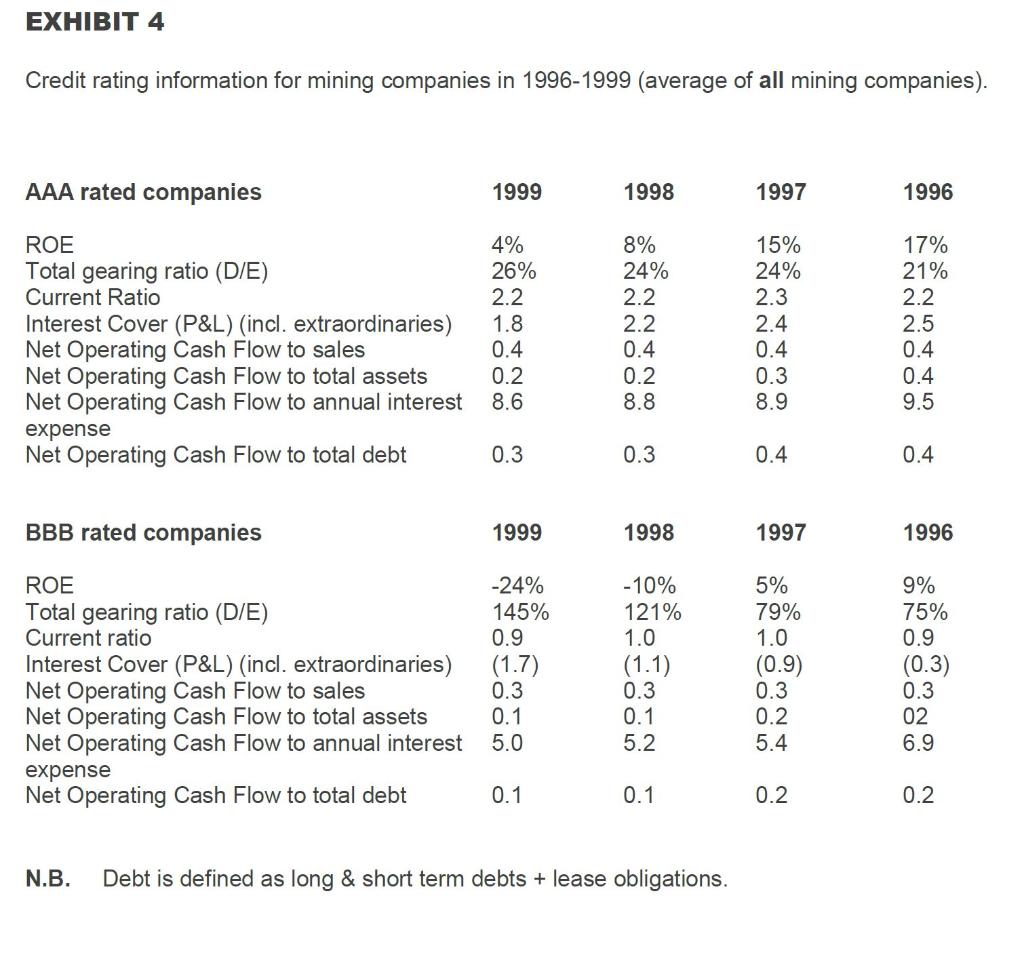
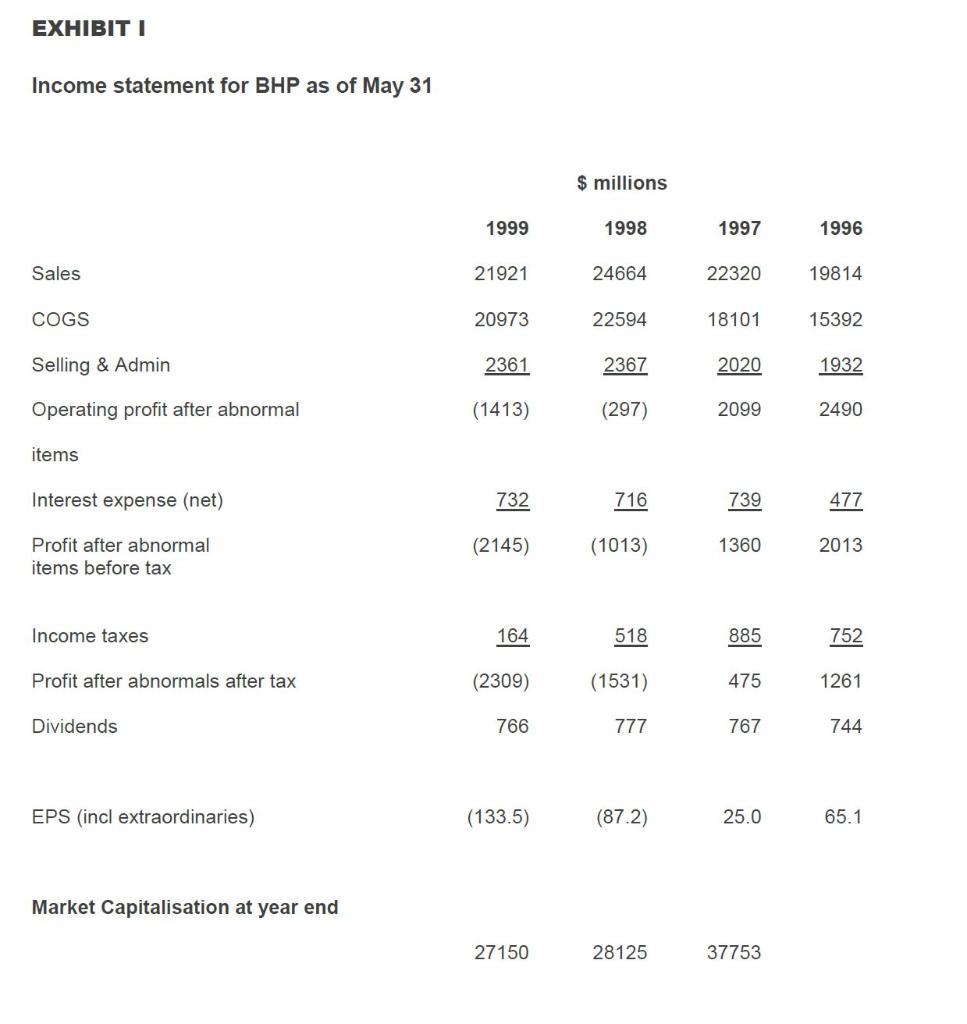
EXHIBITI Income statement for BHP as of May 31 $ millions 1999 1998 1997 1996 Sales 21921 24664 22320 19814 COGS 20973 22594 18101 15392 Selling & Admin 2361 2367 2020 1932 Operating profit after abnormal (1413) (297) 2099 2490 items Interest expense (net) 732 716 739 477 (2145) Profit after abnormal items before tax (1013) 1360 2013 Income taxes 164 518 885 752 Profit after abnormals after tax (2309) (1531) 475 1261 Dividends 766 777 767 744 EPS (incl extraordinaries) (133.5) (87.2) 25.0 65.1 Market Capitalisation at year end 27150 28125 37753 EXHIBIT 2 Consolidated Balance Sheet for BHP 1996-1999 $ millions 1999 1998 1997 1996 Assets Current assets 5852 7218 8399 6820 Fixed assets 25635 29864 28336 28410 Total assets 31487 37082 36735 35230 Liabilities Short term debt 744 643 1846 991 Accounts payable 5445 5487 5447 5467 Other short term Total short term liabilities 5 6194 45 6175 35 7328 45 6503 Long term debt 12646 14489 10973 10770 Capitalised Lease Obligations 99 101 58 63 Deferred taxes & other items 3187 4208 2163 2148 Total non-current obligations 15932 18498 13194 12981 Total Liabilities 22126 24673 20522 19484 Shareholders equity 9361 12409 16213 15746 Cash flows for BHP 1996-1999 1999 1998 1997 1996 Net Operating Cash Flows 3585 3559 3996 3305 Net Investing Cash Flows (1264) (1523) (4348) (7177) Net Financing Cash Flows (2677) (1515) (32) (3578) Net (decrease)/increase in cash flow (356) (521) (384) (294) EXHIBIT 4 Credit rating information for mining companies in 1996-1999 (average of all mining companies). AAA rated companies 1999 1998 1997 1996 ROE Total gearing ratio (D/E) Current Ratio Interest Cover (P&L) (incl. extraordinaries) Net Operating Cash Flow to sales Net Operating Cash Flow to total assets Net Operating Cash Flow to annual interest expense Net Operating Cash Flow to total debt FOO 00 4% 26% 2.2 1.8 0.4 0.2 8.6 ON OON 8% 24% 2.2 2.2 0.4 0.2 8.8 15% 24% 2.3 2.4 0.4 0.3 8.9 17% 21% 2.2 2.5 0.4 0.4 9.5 0.3 0.3 0.4 0.4 BBB rated companies 1999 1998 1997 1996 ROE Total gearing ratio (D/E) Current ratio Interest Cover (P&L) (incl. extraordinaries) Net Operating Cash Flow to sales Net Operating Cash Flow to total assets Net Operating Cash Flow to annual interest expense Net Operating Cash Flow to total debt -24% 145% 0.9 (1.7) 0.3 -10% 121% 1.0 (1.1) 0.3 5% 79% 1.0 (0.9) 0.3 0.2 5.4 9% 75% 0.9 (0.3) 0.3 02 6.9 0.1 0.1 5.0 5.2 0.1 0.1 0.2 0.2 N.B. Debt is defined as long & short term debts + lease obligations. EXHIBITI Income statement for BHP as of May 31 $ millions 1999 1998 1997 1996 Sales 21921 24664 22320 19814 COGS 20973 22594 18101 15392 Selling & Admin 2361 2367 2020 1932 Operating profit after abnormal (1413) (297) 2099 2490 items Interest expense (net) 732 716 739 477 (2145) Profit after abnormal items before tax (1013) 1360 2013 Income taxes 164 518 885 752 Profit after abnormals after tax (2309) (1531) 475 1261 Dividends 766 777 767 744 EPS (incl extraordinaries) (133.5) (87.2) 25.0 65.1 Market Capitalisation at year end 27150 28125 37753 EXHIBITI Income statement for BHP as of May 31 $ millions 1999 1998 1997 1996 Sales 21921 24664 22320 19814 COGS 20973 22594 18101 15392 Selling & Admin 2361 2367 2020 1932 Operating profit after abnormal (1413) (297) 2099 2490 items Interest expense (net) 732 716 739 477 (2145) Profit after abnormal items before tax (1013) 1360 2013 Income taxes 164 518 885 752 Profit after abnormals after tax (2309) (1531) 475 1261 Dividends 766 777 767 744 EPS (incl extraordinaries) (133.5) (87.2) 25.0 65.1 Market Capitalisation at year end 27150 28125 37753 EXHIBIT 2 Consolidated Balance Sheet for BHP 1996-1999 $ millions 1999 1998 1997 1996 Assets Current assets 5852 7218 8399 6820 Fixed assets 25635 29864 28336 28410 Total assets 31487 37082 36735 35230 Liabilities Short term debt 744 643 1846 991 Accounts payable 5445 5487 5447 5467 Other short term Total short term liabilities 5 6194 45 6175 35 7328 45 6503 Long term debt 12646 14489 10973 10770 Capitalised Lease Obligations 99 101 58 63 Deferred taxes & other items 3187 4208 2163 2148 Total non-current obligations 15932 18498 13194 12981 Total Liabilities 22126 24673 20522 19484 Shareholders equity 9361 12409 16213 15746 Cash flows for BHP 1996-1999 1999 1998 1997 1996 Net Operating Cash Flows 3585 3559 3996 3305 Net Investing Cash Flows (1264) (1523) (4348) (7177) Net Financing Cash Flows (2677) (1515) (32) (3578) Net (decrease)/increase in cash flow (356) (521) (384) (294) EXHIBIT 4 Credit rating information for mining companies in 1996-1999 (average of all mining companies). AAA rated companies 1999 1998 1997 1996 ROE Total gearing ratio (D/E) Current Ratio Interest Cover (P&L) (incl. extraordinaries) Net Operating Cash Flow to sales Net Operating Cash Flow to total assets Net Operating Cash Flow to annual interest expense Net Operating Cash Flow to total debt FOO 00 4% 26% 2.2 1.8 0.4 0.2 8.6 ON OON 8% 24% 2.2 2.2 0.4 0.2 8.8 15% 24% 2.3 2.4 0.4 0.3 8.9 17% 21% 2.2 2.5 0.4 0.4 9.5 0.3 0.3 0.4 0.4 BBB rated companies 1999 1998 1997 1996 ROE Total gearing ratio (D/E) Current ratio Interest Cover (P&L) (incl. extraordinaries) Net Operating Cash Flow to sales Net Operating Cash Flow to total assets Net Operating Cash Flow to annual interest expense Net Operating Cash Flow to total debt -24% 145% 0.9 (1.7) 0.3 -10% 121% 1.0 (1.1) 0.3 5% 79% 1.0 (0.9) 0.3 0.2 5.4 9% 75% 0.9 (0.3) 0.3 02 6.9 0.1 0.1 5.0 5.2 0.1 0.1 0.2 0.2 N.B. Debt is defined as long & short term debts + lease obligations. EXHIBITI Income statement for BHP as of May 31 $ millions 1999 1998 1997 1996 Sales 21921 24664 22320 19814 COGS 20973 22594 18101 15392 Selling & Admin 2361 2367 2020 1932 Operating profit after abnormal (1413) (297) 2099 2490 items Interest expense (net) 732 716 739 477 (2145) Profit after abnormal items before tax (1013) 1360 2013 Income taxes 164 518 885 752 Profit after abnormals after tax (2309) (1531) 475 1261 Dividends 766 777 767 744 EPS (incl extraordinaries) (133.5) (87.2) 25.0 65.1 Market Capitalisation at year end 27150 28125 37753


