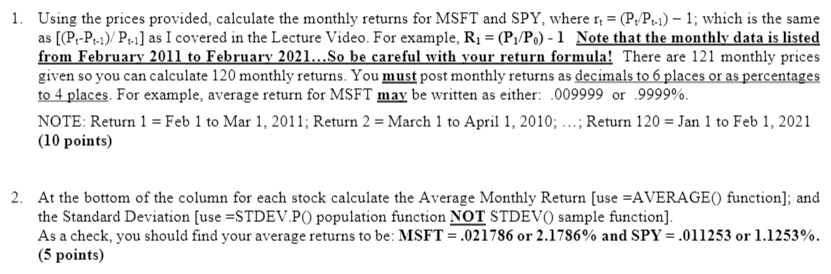
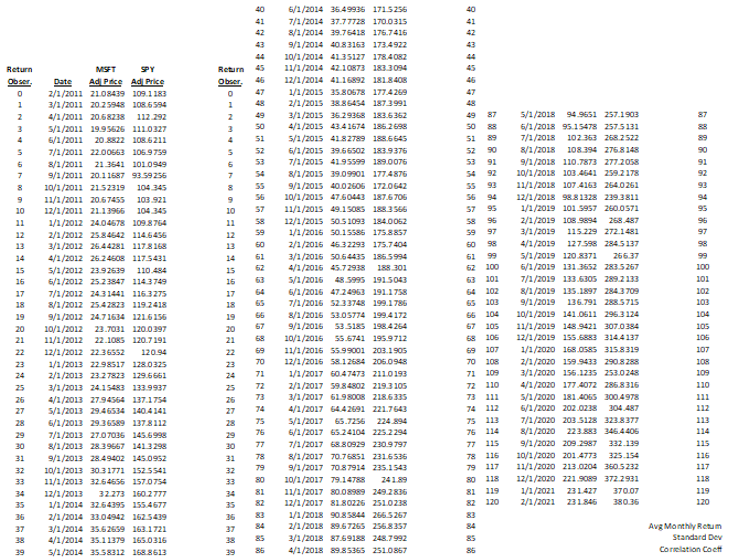
1. Using the prices provided, calculate the monthly returns for MSFT and SPY, where 14 = (PH/P-1) - 1; which is the same as [(P-P-1)/P:-) as I covered in the Lecture Video. For example, R1 = (P./P.) - 1 Note that the monthly data is listed from February 2011 to February 2021... So be careful with your return formula! There are 121 monthly prices given so you can calculate 120 monthly returns. You must post monthly returns as decimals to 6 places or as percentages to 4 places. For example, average return for MSFT may be written as either: .009999 or 9999%. NOTE: Return 1 = Feb 1 to Mar 1, 2011; Return 2 = March 1 to April 1, 2010; ...; Return 120 = Jan 1 to Feb 1, 2021 (10 points) 2. At the bottom of the column for each stock calculate the Average Monthly Return [use =AVERAGE() function]; and the Standard Deviation [use ESTDEV.PO population function NOT STDEV() sample function]. As a check, you should find your average returns to be: MSFT = .021786 or 2.1786% and SPY = .011253 or 1.1253%. (5 points) 40 41 46 Return Obser 0 1 2 3 87 5 89 90 91 7 Return 45 Obrer 0 47 1 2 3 50 51 s 52 53 7 54 a 56 10 57 11 58 12 59 13 60 14 61 15 16 17 50 5189 5290 5391 54 92 SS 56 94 57 95 58 5997 93 94 95 10 11 12 13 97 15 16 17 18 MSFT SPY Date Ad Pace Ad Price 2/1/2011 21.08439 109.1183 3/1/2011 20.25948 108.6594 4/1/2011 20.68238 112 292 5/1/2011 19.95626 111.0327 6/1/2011 20.8822 108.6211 7/1/2011 22.00563 106.9759 8/1/2011 21 3541 101 0949 9/1/2011 20.11587 93.59256 10/1/2011 2152319 104 345 11/1/2011 20.67455 103.921 12/1/2011 21.13966 104 345 1/1/2012 24.04678 109.8754 2/1/2012 25.84542 114.6456 3/1/2012 26.44281 117.8168 4/1/2012 26.24508 1175431 5/1/2012 23.92539 110.484 6/1/2012 25.23847 114.3 749 7/1/2012 243 1441 116.3275 8/1/2012 25.42823 119 2418 9/1/2012 24.71634 121.6156 10/1/2012 23.7031 120.0397 11/1/2012 22.1085 120.7 191 12/1/2012 2236552 120.94 1/1/2013 22.98517 128.0325 2/1/2013 23.27823 129.5551 3/1/2013 24.15483 133.9937 4/1/2013 27.94564 137.1754 5/1/2013 29.46534 140.4141 6/1/2013 29.36589 2378112 7/1/2013 27.07035 145.6998 2/1/2013 28.39667 1413298 9/1/2013 28.49402 145.0952 10/1/2013 30-31771 152.5541 11/1/2013 32.646.56 157 0754 12/1/2013 32 273 260 2777 1/1/2014 32.64395 155.4677 2/1/2014 33.04942 162.5439 3/1/2014 35.62659 163.1721 4/1/2014 35.1 1379 165.0316 S/1/2014 35.58312 168.8613 6/1/2014 35.49935 171.5256 7/1/2014 37.77728 170.0315 8/1/2014 39.76418 176.7416 9/1/2014 4083163 173.4922 10/1/2014 41.35127 178.4082 11/1/2014 42.10873 183.3094 12/1/2014 41.16892 181.8408 1/1/2015 35.80578 177.4269 2/1/2015 38.85454 1873991 3/1/2015 36.29358 183.6352 4/1/2015 43.4 1674 186.2698 5/1/2015 41.82789 188,5545 6/1/2015 39.66502 183.9376 7/1/2015 41.95599 189.0075 8/1/2015 39.09901 1774876 9/1/2015 40.02505 172.0542 10/1/2015 47.60443 187.6705 11/1/2015 49.15085 188.3566 12/1/2015 50.5 1093 184.0052 1/1/2016 50.15585 175.8857 2/1/2016 45.3 2293 175.7404 3/1/2016 50.64435 185.5994 4/1/2016 45.72938 188 301 5/1/2016 48.5995 191.5043 6/1/2016 472 4963 191.1758 7/1/2016 5233748 199.1 785 8/1/2015 53.05774 199.4172 9/1/2016 53 5185 198.4254 10/1/2015 55.6741 195.9712 11/1/2016 55.99001 203.1995 12/1/2016 58 12684 206.0948 1/1/2017 60.47473 2110193 2/1/2017 59.84802 219.3 105 3/1/2017 61.98008 218,6335 4/1/2017 64.42591 221.7543 5/1/2017 65.7256 224 894 6/1/2017 65.24104 225.2 294 7/1/2017 68.80929 230.9797 8/1/2017 70.76851 231.5535 9/1/2017 70.87914 235.1543 10/1/2017 79.14788 241.89 11/1/2017 80.08989 249.2836 12/1/2017 81.80226 251.0 238 1/1/2018 90.8 5844 266.5 267 2/1/2018 89.67255 256.8357 3/1/2018 87.69188 248.7992 4/1/2018 89.85365 251.0867 5/1/2018 94.9651 257.1903 6/1/2018 95.15478 2575131 7/1/2018 102.353 258 2522 8/1/2018 108.394 276.8148 9/1/2018 110.7873 2772058 20/1/2018 103.4541 259.2178 11/1/2018 107 4163 264.0261 12/1/2018 98.8 1328 229.3811 1/1/2019 101 5957 250.0571 2/1/2019 103.9894 258.487 3/1/2019 115.229 272.1481 4/1/2019 127.598 2845137 5/1/2019 120.8371 256.37 6/1/2019 131 3652 283.5267 7/1/2019 133.6305 289.2 133 8/1/2019 135.1897 284 3709 9/1/2019 136.791 288.5715 10/1/2019 141.0611 2963 124 11/1/2019 148.9421 307.0384 12/1/2019 155.6883 314.4137 1/1/2020 168.0585 3158319 2/1/2020 159.3433 290.8288 3/1/2020 156.1735 253.0 243 4/1/2020 177 4072 2868316 5/1/2020 181.4065 300.4978 6/1/2020 202.0238 304 487 7/1/2020 203 5128 323.8377 8/1/2020 223 883 346.4406 9/1/2020 209 2987 332 139 10/1/2020 201.4773 325 154 11/1/2020 213.0204 360,5232 12/1/2020 221 9089 372.2931 1/1/2022 231427 370.07 2/1/2021 231846 380.36 66 21 22 23 20 21 22 23 61 200 63 101 64 102 65 103 66 104 105 106 69 107 70 108 71 109 72 110 73 111 74 112 75 113 75 114 77 115 78 225 79117 80 118 81 82 120 99 100 101 102 103 104 105 105 107 108 109 110 111 112 113 114 115 116 117 118 119 120 25 70 71 72 73 74 75 75 77 78 79 80 81 27 27 28 30 31 32 33 29 30 31 32 33 34 83 36 37 Avg Monthly Retum Standard Dev Correlation Cocht 39 85 85 1. Using the prices provided, calculate the monthly returns for MSFT and SPY, where 14 = (PH/P-1) - 1; which is the same as [(P-P-1)/P:-) as I covered in the Lecture Video. For example, R1 = (P./P.) - 1 Note that the monthly data is listed from February 2011 to February 2021... So be careful with your return formula! There are 121 monthly prices given so you can calculate 120 monthly returns. You must post monthly returns as decimals to 6 places or as percentages to 4 places. For example, average return for MSFT may be written as either: .009999 or 9999%. NOTE: Return 1 = Feb 1 to Mar 1, 2011; Return 2 = March 1 to April 1, 2010; ...; Return 120 = Jan 1 to Feb 1, 2021 (10 points) 2. At the bottom of the column for each stock calculate the Average Monthly Return [use =AVERAGE() function]; and the Standard Deviation [use ESTDEV.PO population function NOT STDEV() sample function]. As a check, you should find your average returns to be: MSFT = .021786 or 2.1786% and SPY = .011253 or 1.1253%. (5 points) 40 41 46 Return Obser 0 1 2 3 87 5 89 90 91 7 Return 45 Obrer 0 47 1 2 3 50 51 s 52 53 7 54 a 56 10 57 11 58 12 59 13 60 14 61 15 16 17 50 5189 5290 5391 54 92 SS 56 94 57 95 58 5997 93 94 95 10 11 12 13 97 15 16 17 18 MSFT SPY Date Ad Pace Ad Price 2/1/2011 21.08439 109.1183 3/1/2011 20.25948 108.6594 4/1/2011 20.68238 112 292 5/1/2011 19.95626 111.0327 6/1/2011 20.8822 108.6211 7/1/2011 22.00563 106.9759 8/1/2011 21 3541 101 0949 9/1/2011 20.11587 93.59256 10/1/2011 2152319 104 345 11/1/2011 20.67455 103.921 12/1/2011 21.13966 104 345 1/1/2012 24.04678 109.8754 2/1/2012 25.84542 114.6456 3/1/2012 26.44281 117.8168 4/1/2012 26.24508 1175431 5/1/2012 23.92539 110.484 6/1/2012 25.23847 114.3 749 7/1/2012 243 1441 116.3275 8/1/2012 25.42823 119 2418 9/1/2012 24.71634 121.6156 10/1/2012 23.7031 120.0397 11/1/2012 22.1085 120.7 191 12/1/2012 2236552 120.94 1/1/2013 22.98517 128.0325 2/1/2013 23.27823 129.5551 3/1/2013 24.15483 133.9937 4/1/2013 27.94564 137.1754 5/1/2013 29.46534 140.4141 6/1/2013 29.36589 2378112 7/1/2013 27.07035 145.6998 2/1/2013 28.39667 1413298 9/1/2013 28.49402 145.0952 10/1/2013 30-31771 152.5541 11/1/2013 32.646.56 157 0754 12/1/2013 32 273 260 2777 1/1/2014 32.64395 155.4677 2/1/2014 33.04942 162.5439 3/1/2014 35.62659 163.1721 4/1/2014 35.1 1379 165.0316 S/1/2014 35.58312 168.8613 6/1/2014 35.49935 171.5256 7/1/2014 37.77728 170.0315 8/1/2014 39.76418 176.7416 9/1/2014 4083163 173.4922 10/1/2014 41.35127 178.4082 11/1/2014 42.10873 183.3094 12/1/2014 41.16892 181.8408 1/1/2015 35.80578 177.4269 2/1/2015 38.85454 1873991 3/1/2015 36.29358 183.6352 4/1/2015 43.4 1674 186.2698 5/1/2015 41.82789 188,5545 6/1/2015 39.66502 183.9376 7/1/2015 41.95599 189.0075 8/1/2015 39.09901 1774876 9/1/2015 40.02505 172.0542 10/1/2015 47.60443 187.6705 11/1/2015 49.15085 188.3566 12/1/2015 50.5 1093 184.0052 1/1/2016 50.15585 175.8857 2/1/2016 45.3 2293 175.7404 3/1/2016 50.64435 185.5994 4/1/2016 45.72938 188 301 5/1/2016 48.5995 191.5043 6/1/2016 472 4963 191.1758 7/1/2016 5233748 199.1 785 8/1/2015 53.05774 199.4172 9/1/2016 53 5185 198.4254 10/1/2015 55.6741 195.9712 11/1/2016 55.99001 203.1995 12/1/2016 58 12684 206.0948 1/1/2017 60.47473 2110193 2/1/2017 59.84802 219.3 105 3/1/2017 61.98008 218,6335 4/1/2017 64.42591 221.7543 5/1/2017 65.7256 224 894 6/1/2017 65.24104 225.2 294 7/1/2017 68.80929 230.9797 8/1/2017 70.76851 231.5535 9/1/2017 70.87914 235.1543 10/1/2017 79.14788 241.89 11/1/2017 80.08989 249.2836 12/1/2017 81.80226 251.0 238 1/1/2018 90.8 5844 266.5 267 2/1/2018 89.67255 256.8357 3/1/2018 87.69188 248.7992 4/1/2018 89.85365 251.0867 5/1/2018 94.9651 257.1903 6/1/2018 95.15478 2575131 7/1/2018 102.353 258 2522 8/1/2018 108.394 276.8148 9/1/2018 110.7873 2772058 20/1/2018 103.4541 259.2178 11/1/2018 107 4163 264.0261 12/1/2018 98.8 1328 229.3811 1/1/2019 101 5957 250.0571 2/1/2019 103.9894 258.487 3/1/2019 115.229 272.1481 4/1/2019 127.598 2845137 5/1/2019 120.8371 256.37 6/1/2019 131 3652 283.5267 7/1/2019 133.6305 289.2 133 8/1/2019 135.1897 284 3709 9/1/2019 136.791 288.5715 10/1/2019 141.0611 2963 124 11/1/2019 148.9421 307.0384 12/1/2019 155.6883 314.4137 1/1/2020 168.0585 3158319 2/1/2020 159.3433 290.8288 3/1/2020 156.1735 253.0 243 4/1/2020 177 4072 2868316 5/1/2020 181.4065 300.4978 6/1/2020 202.0238 304 487 7/1/2020 203 5128 323.8377 8/1/2020 223 883 346.4406 9/1/2020 209 2987 332 139 10/1/2020 201.4773 325 154 11/1/2020 213.0204 360,5232 12/1/2020 221 9089 372.2931 1/1/2022 231427 370.07 2/1/2021 231846 380.36 66 21 22 23 20 21 22 23 61 200 63 101 64 102 65 103 66 104 105 106 69 107 70 108 71 109 72 110 73 111 74 112 75 113 75 114 77 115 78 225 79117 80 118 81 82 120 99 100 101 102 103 104 105 105 107 108 109 110 111 112 113 114 115 116 117 118 119 120 25 70 71 72 73 74 75 75 77 78 79 80 81 27 27 28 30 31 32 33 29 30 31 32 33 34 83 36 37 Avg Monthly Retum Standard Dev Correlation Cocht 39 85 85