

Answered step by step
Verified Expert Solution
Question
1 Approved Answer
1. We discovered that 1,013 GSS respondents in 2010 watched television for an average of 3.01 hr/day, with a standard deviation of 2.65 hr.
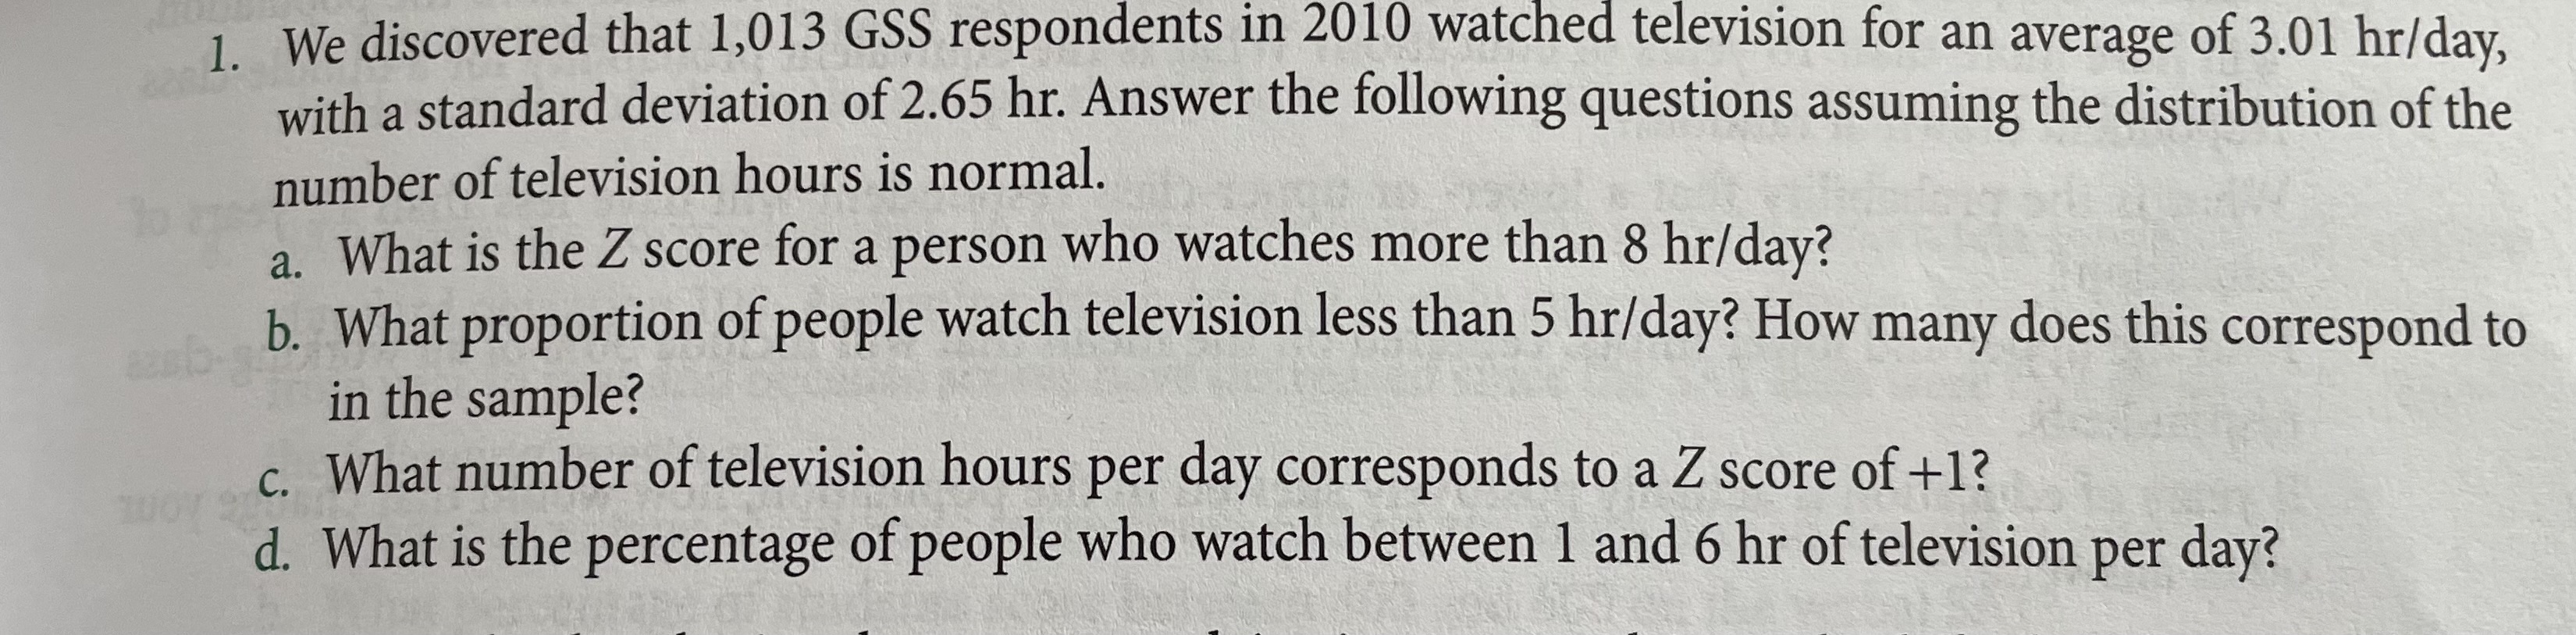
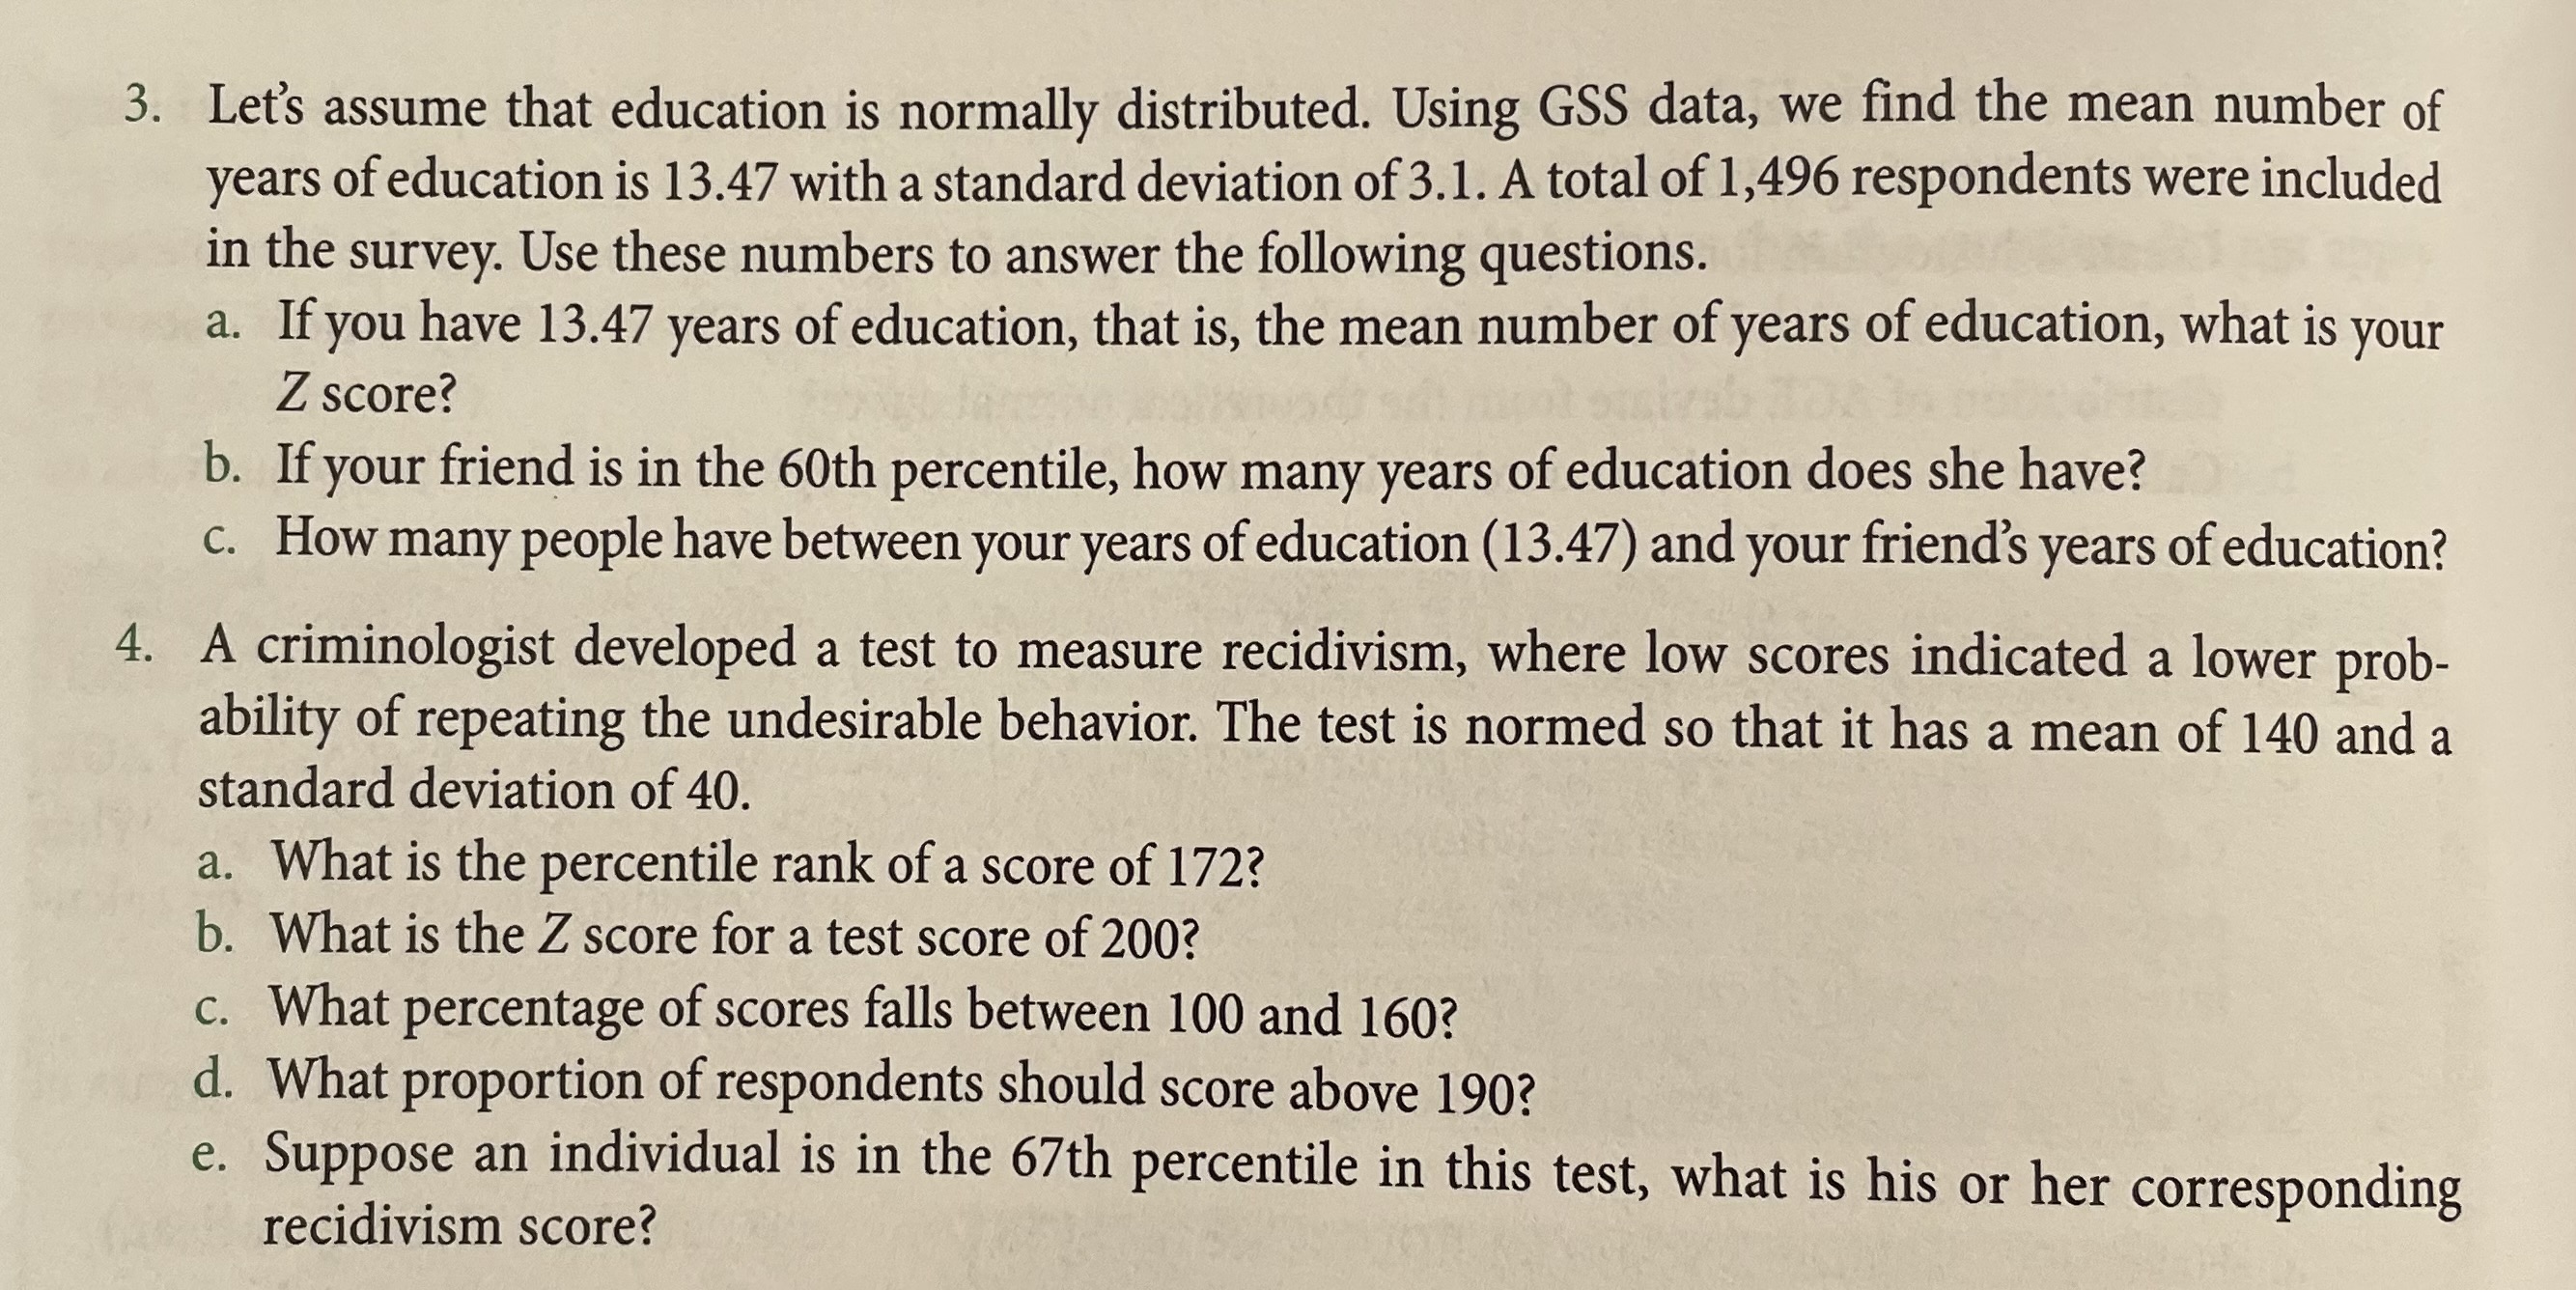
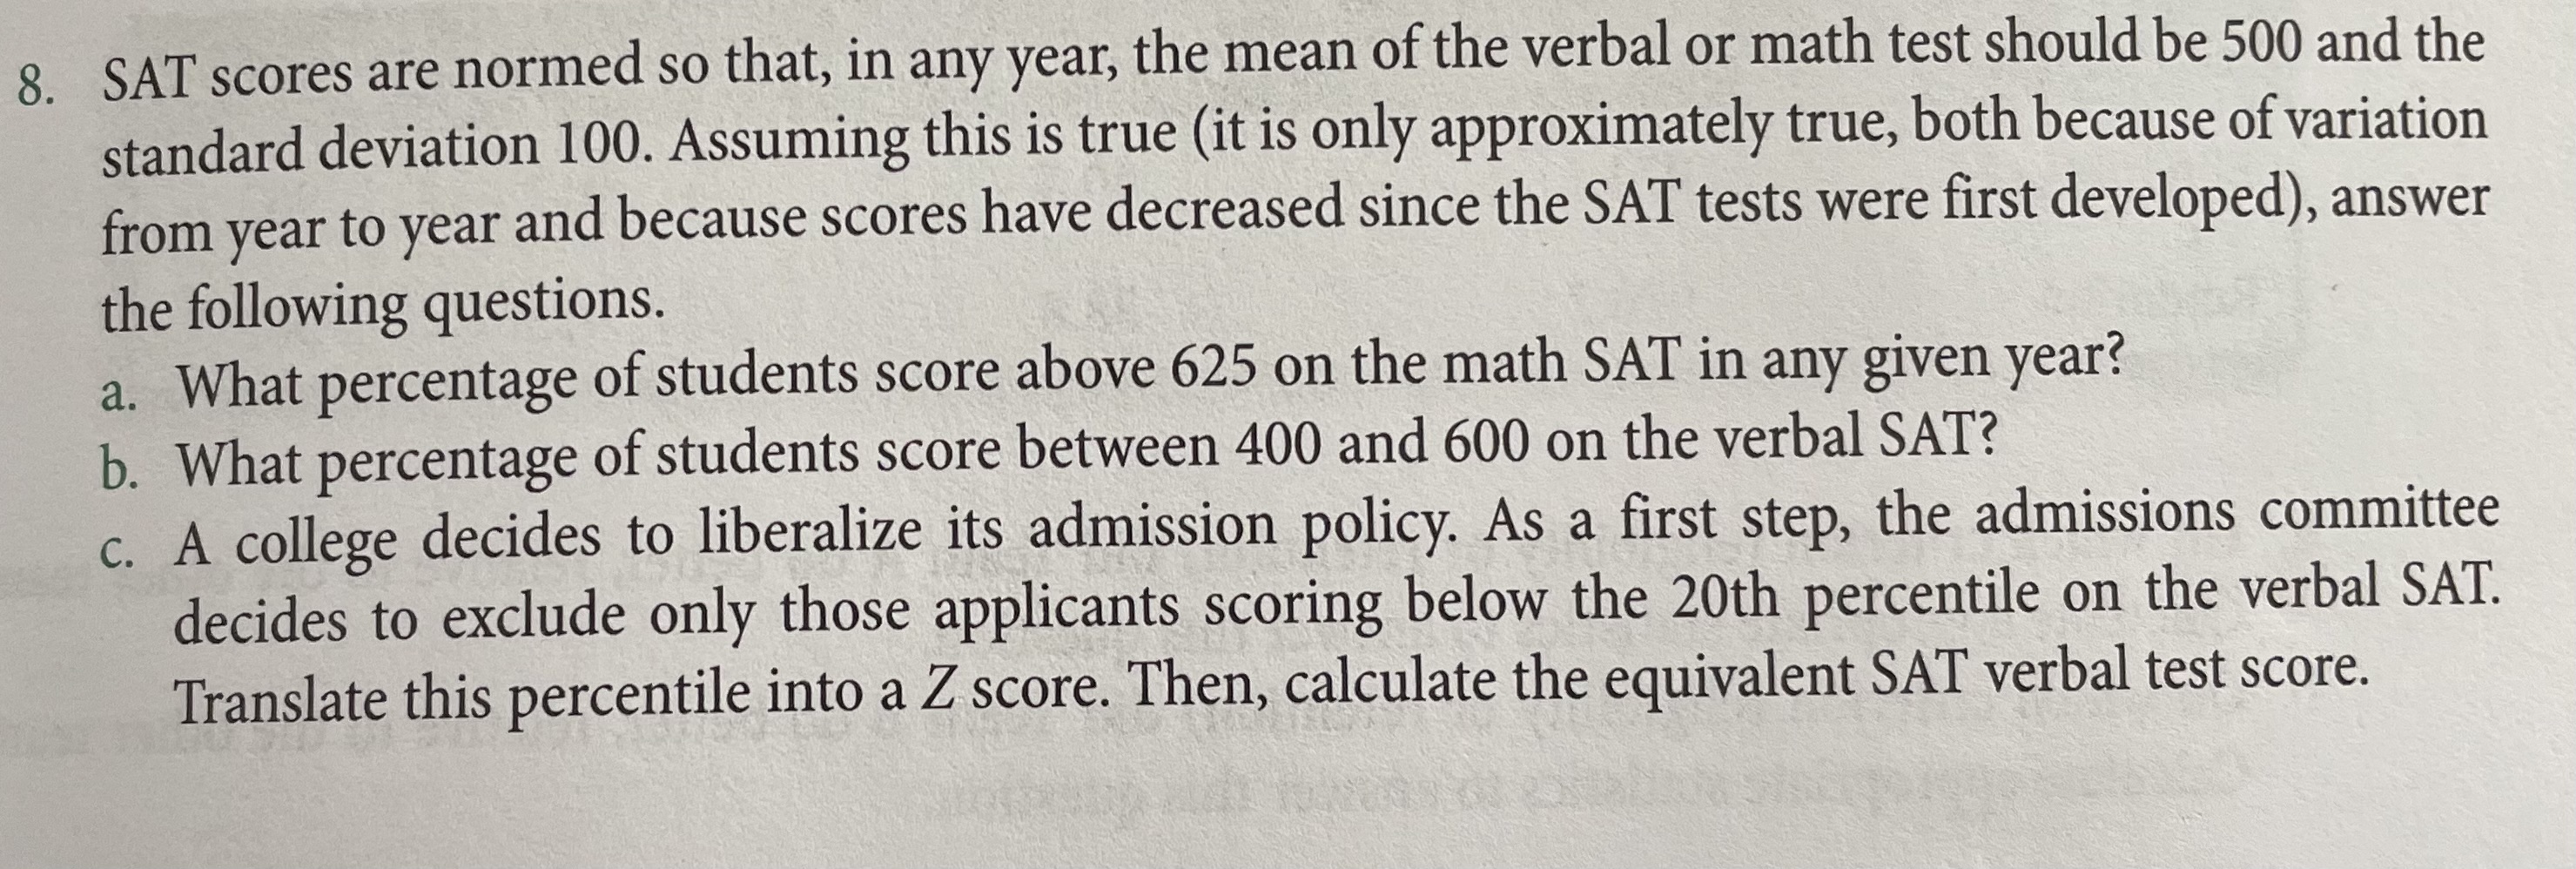
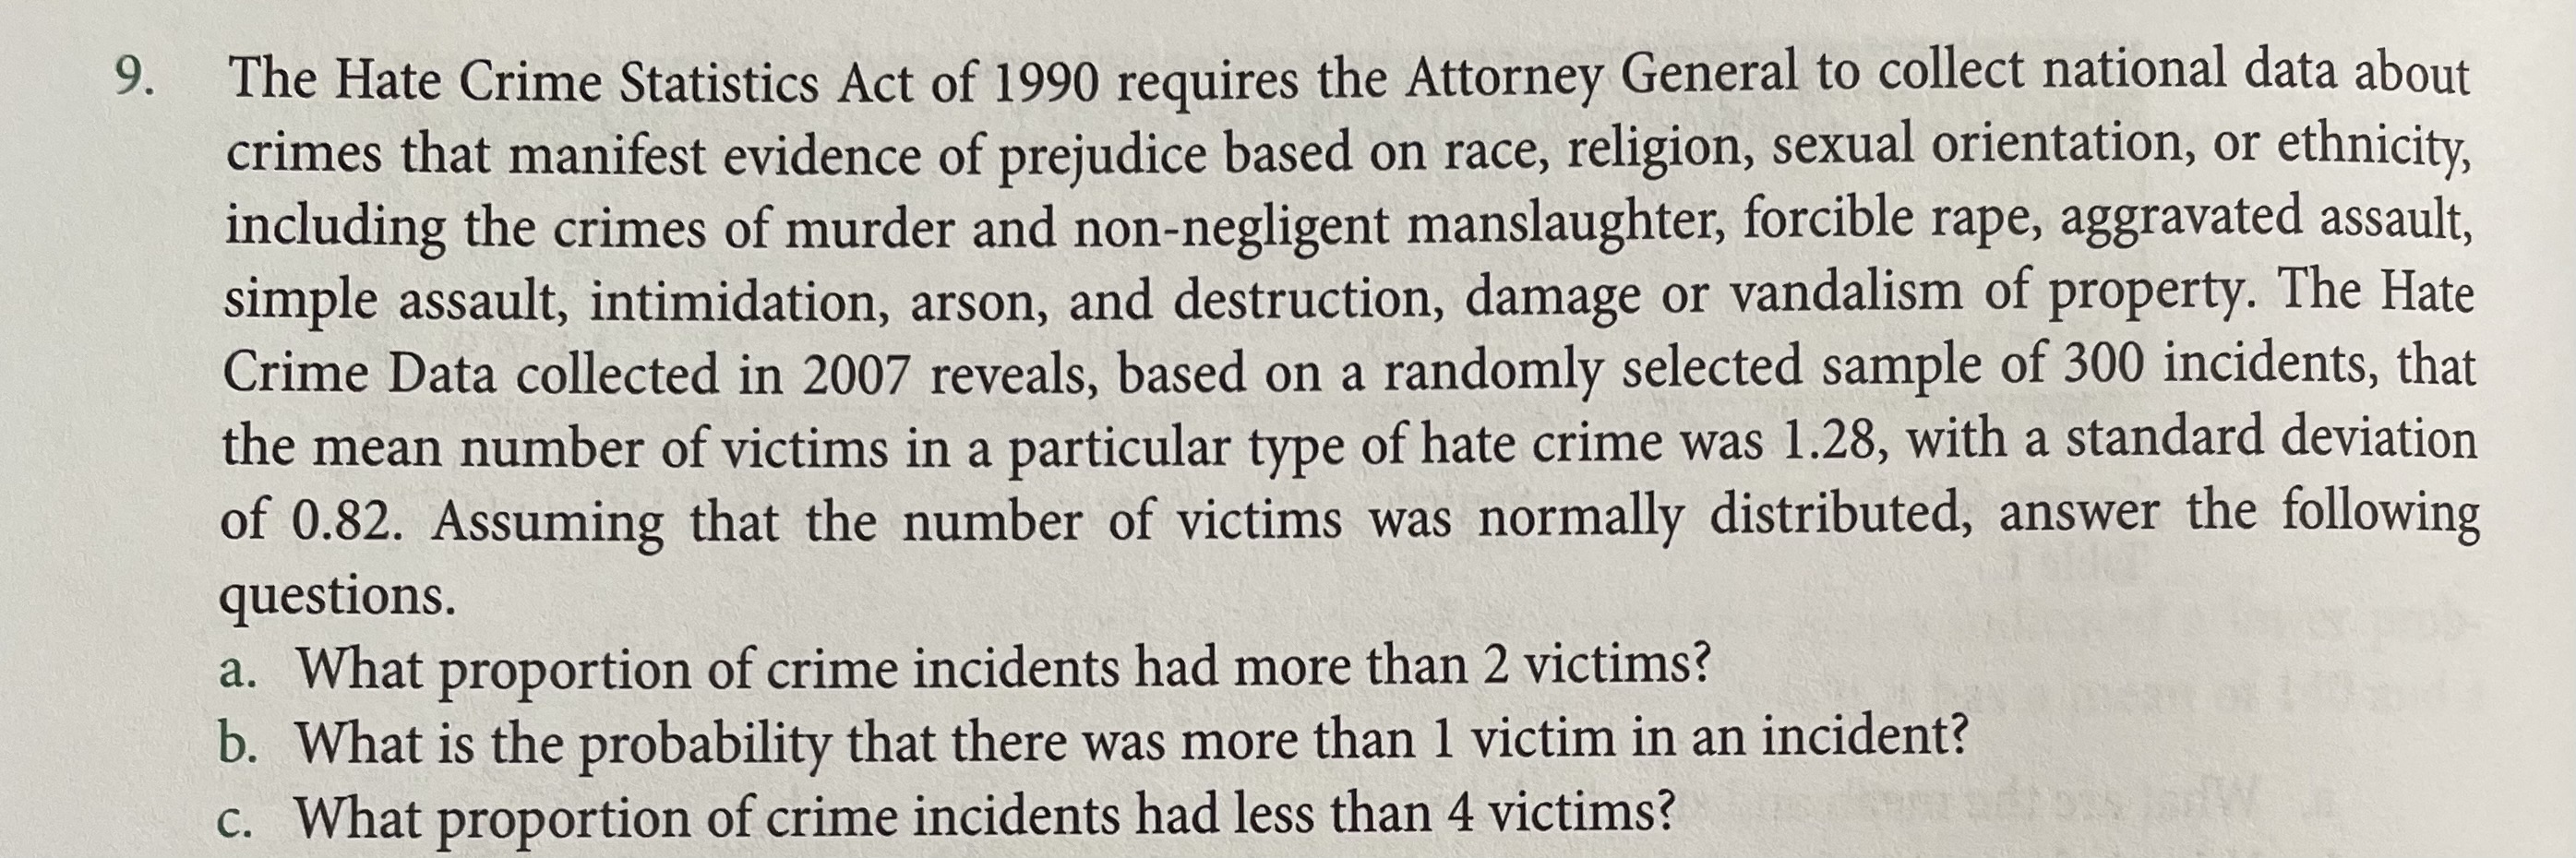
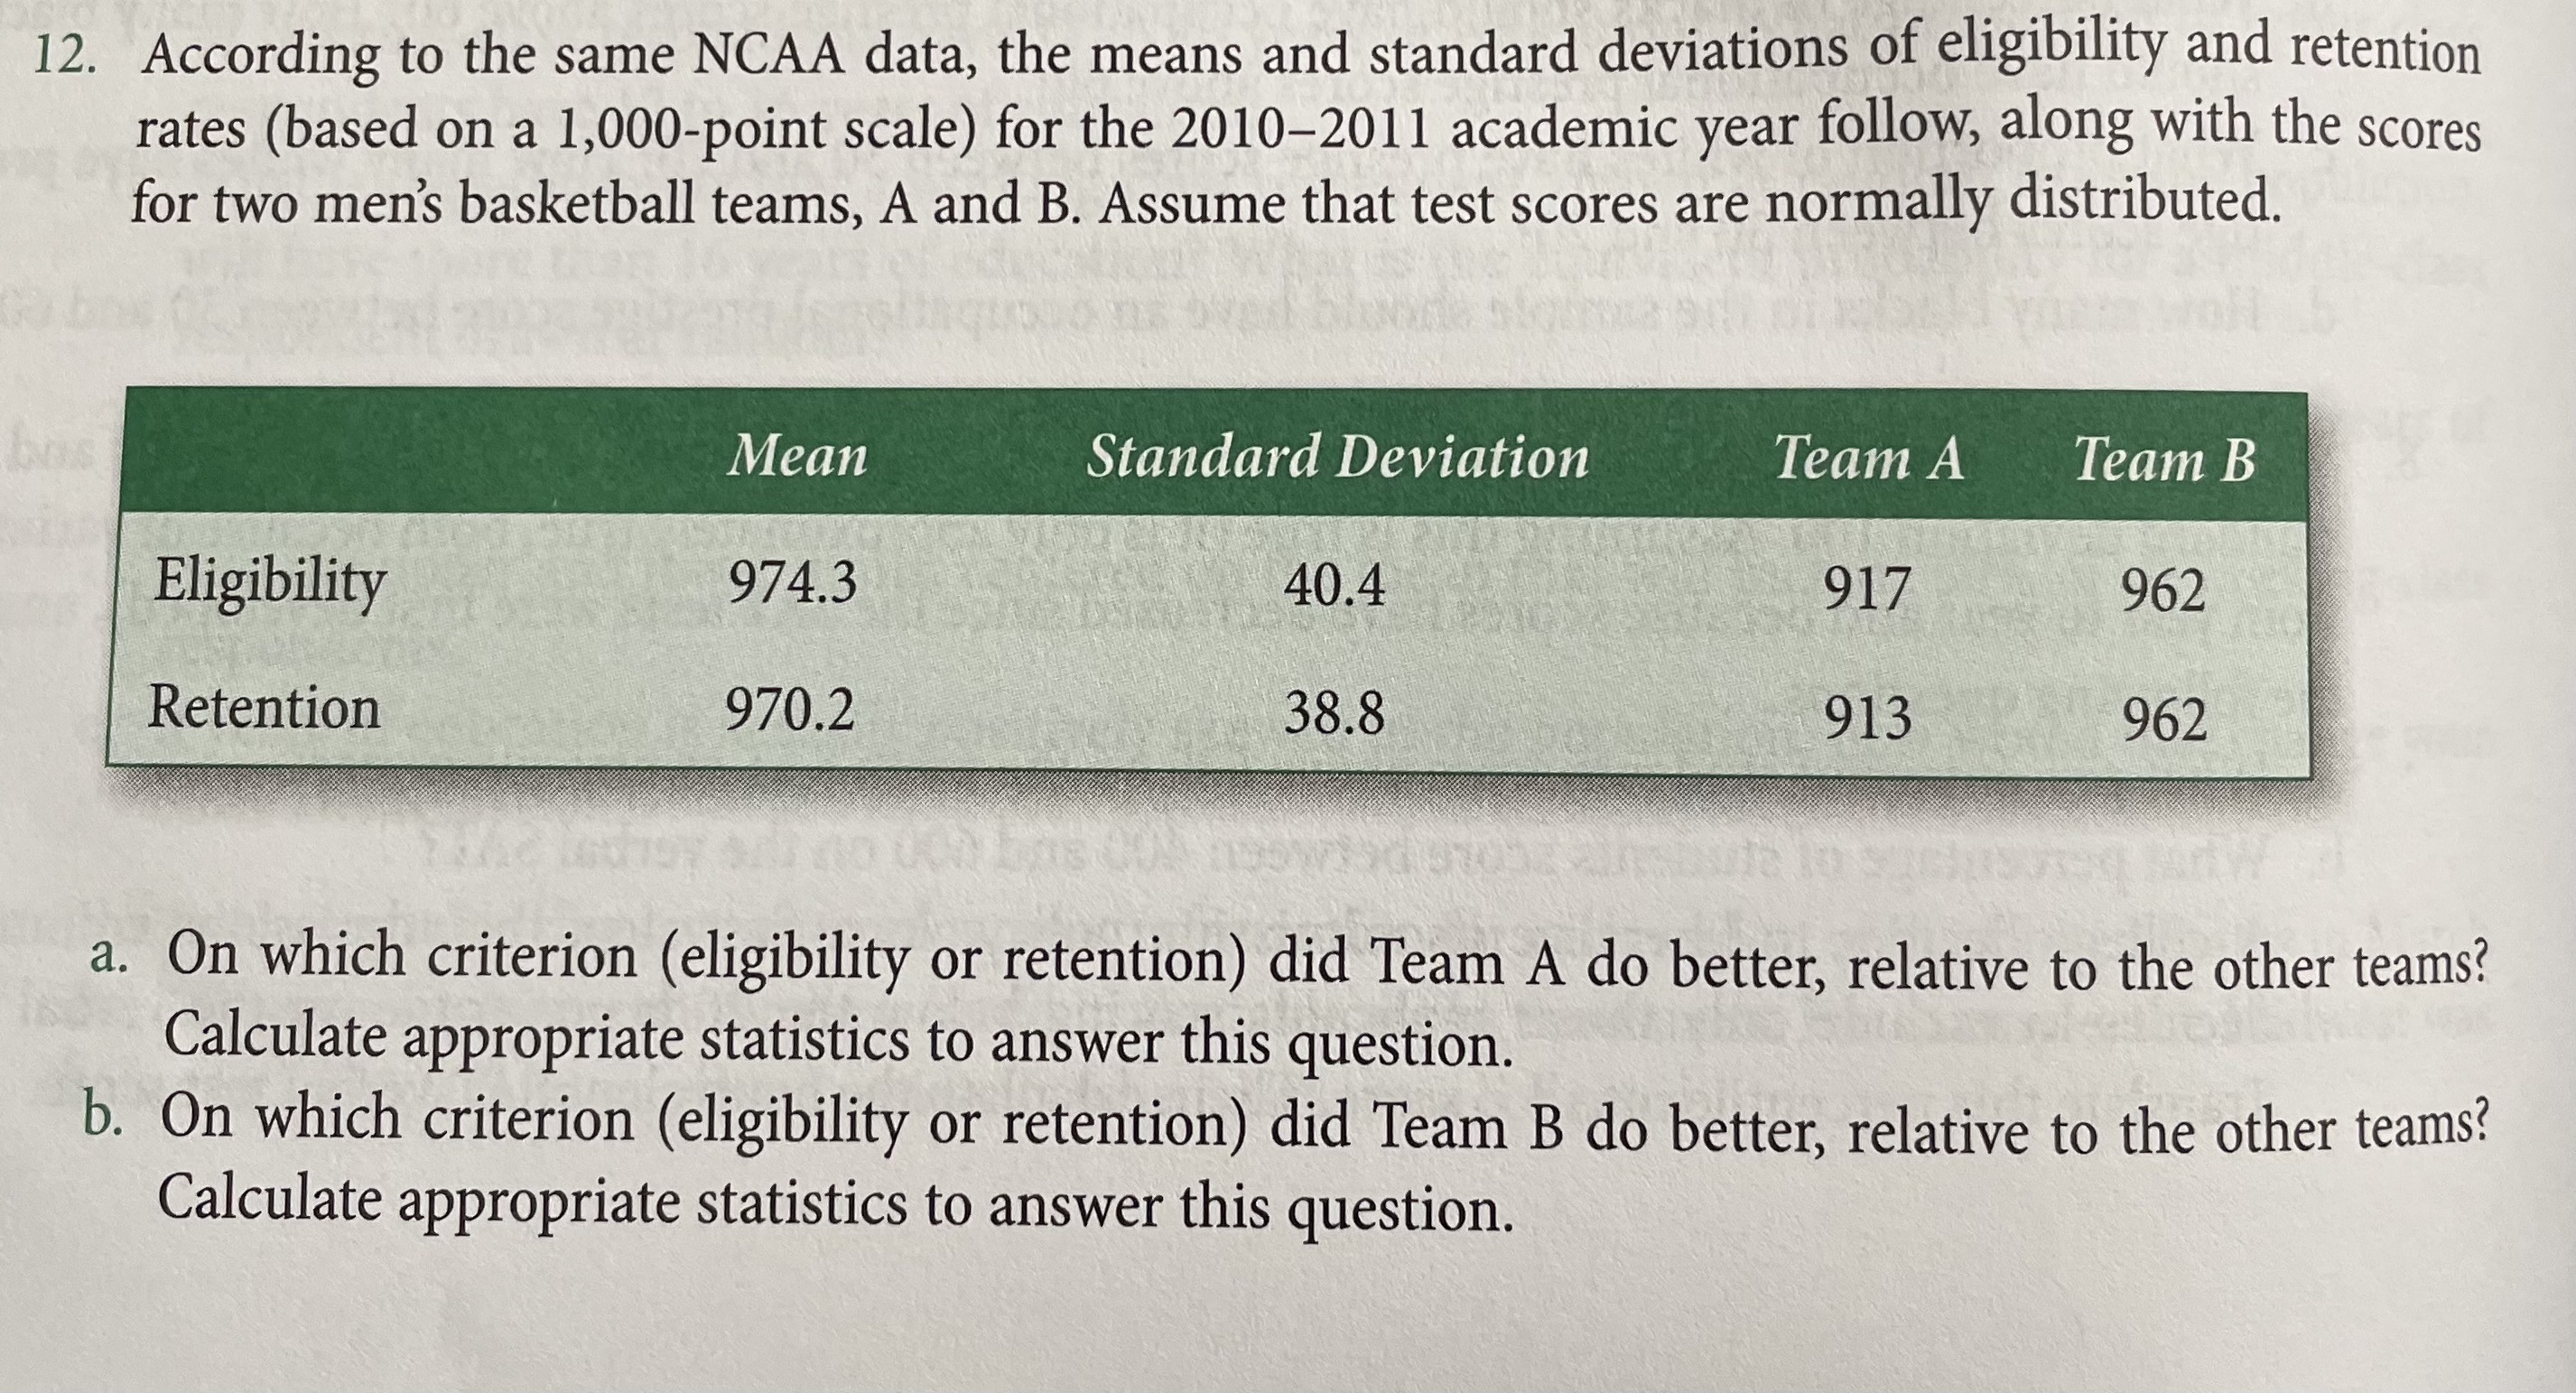

1. We discovered that 1,013 GSS respondents in 2010 watched television for an average of 3.01 hr/day, with a standard deviation of 2.65 hr. Answer the following questions assuming the distribution of the number of television hours is normal. a. What is the Z score for a person who watches more than 8 hr/day? b. What proportion of people watch television less than 5 hr/day? How many does this correspond to in the sample? c. What number of television hours per day corresponds to a Z score of +1? d. What is the percentage of people who watch between 1 and 6 hr of television per day? 3. Let's assume that education is normally distributed. Using GSS data, we find the mean number of years of education is 13.47 with a standard deviation of 3.1. A total of 1,496 respondents were included in the survey. Use these numbers to answer the following questions. a. If you have 13.47 years of education, that is, the mean number of years of education, what is Z score? b. If your friend is in the 60th percentile, how many years of education does she have? your c. How many people have between your years of education (13.47) and your friend's years of education? 4. A criminologist developed a test to measure recidivism, where low scores indicated a lower prob- ability of repeating the undesirable behavior. The test is normed so that it has a mean of 140 and a standard deviation of 40. a. What is the percentile rank of a score of 172? b. What is the Z score for a test score of 200? c. What percentage of scores falls between 100 and 160? d. What proportion of respondents should score above 190? e. Suppose an individual is in the 67th percentile in this test, what is his or her corresponding recidivism score? 8. SAT scores are normed so that, in any year, the mean of the verbal or math test should be 500 and the standard deviation 100. Assuming this is true (it is only approximately true, both because of variation from year to year and because scores have decreased since the SAT tests were first developed), answer the following questions. a. What percentage of students score above 625 on the math SAT in any given year? b. What percentage of students score between 400 and 600 on the verbal SAT? c. A college decides to liberalize its admission policy. As a first step, the admissions committee decides to exclude only those applicants scoring below the 20th percentile on the verbal SAT. Translate this percentile into a Z score. Then, calculate the equivalent SAT verbal test score. 9. The Hate Crime Statistics Act of 1990 requires the Attorney General to collect national data about crimes that manifest evidence of prejudice based on race, religion, sexual orientation, or ethnicity, including the crimes of murder and non-negligent manslaughter, forcible rape, aggravated assault, simple assault, intimidation, arson, and destruction, damage or vandalism of property. The Hate Crime Data collected in 2007 reveals, based on a randomly selected sample of 300 incidents, that the mean number of victims in a particular type of hate crime was 1.28, with a standard deviation of 0.82. Assuming that the number of victims was normally distributed, answer the following questions. a. What proportion of crime incidents had more than 2 victims? b. What is the probability that there was more than 1 victim in an incident? c. What proportion of crime incidents had less than 4 victims? 12. According to the same NCAA data, the means and standard deviations of eligibility and retention rates (based on a 1,000-point scale) for the 2010-2011 academic year follow, along with the scores for two men's basketball teams, A and B. Assume that test scores are normally distributed. bas Mean Standard Deviation Team A Team B Eligibility 974.3 40.4 917 962 Retention 970.2 38.8 913 962 a. On which criterion (eligibility or retention) did Team A do better, relative to the other teams? Calculate appropriate statistics to answer this question. b. On which criterion (eligibility or retention) did Team B do better, relative to the other teams? Calculate appropriate statistics to answer this question. The Normal Distribution c. What proportion of the teams have retention rates below the retention rate of Team B? d. What is the percentile rank of Team A's eligibility rate? score for any standard normal distribution? What is the value o
Step by Step Solution
There are 3 Steps involved in it
Step: 1

Get Instant Access to Expert-Tailored Solutions
See step-by-step solutions with expert insights and AI powered tools for academic success
Step: 2

Step: 3
Ace Your Homework with AI
Get the answers you need in no time with our AI-driven, step-by-step assistance
Get Started
Applied Linear Algebra
Authors: Peter J. Olver, Cheri Shakiban
1st edition
131473824, 978-0131473829