1. What are the business cases for each of the two projects, Match My Doll Clothing (MMDC) and Design Your Own Doll (DYOD).
Which case is more compelling from a qualitative point of view? Note bullet points are fine to answer this.
2. Find the NPV and IRR of both projects in the Excel sheet provided (use the NPV and IRR excel formulas)
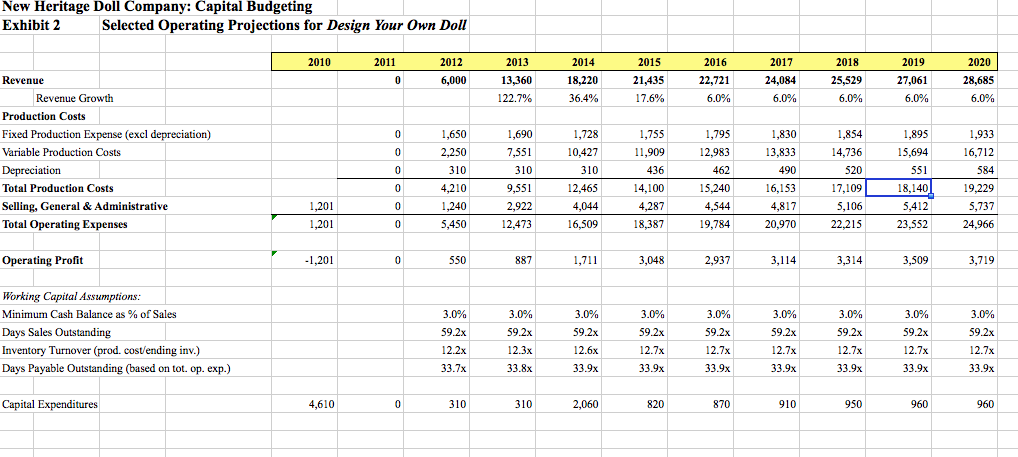
New Heritage Doll Company: Capital Budgeting Exhibit 2 Selected Operating Projections for Design Your Own Doll 2010 2012 2017 2011 2013 2014 2015 2016 2018 2019 2020 21,435 22,721 27,061 Revenue 0 6,000 13,360 18,220 24,084 25,529 28,685 17.6% Revenue Growth 122.7% 36.4% 6.0% 6.0% 6.0% 6.0% 6.0% Production Costs 1,650 1,690 1,830 1,854 1,895 Fixed Production Expense (excl depreciation) 0 1,728 1,755 1,795 1,933 Variable Production Costs 0 2,250 7,551 10,427 11,909 12,983 13,833 14,736 15,694 16,712 Depreciation 0 310 310 310 436 462 490 520 551 584 18,140 Total Production Costs 0 4,210 9,55 12,465 14,100 15,240 16,153 17,109 19,229 5,106 Selling, General & Administrative 1,201 0 1,240 2,922 4,044 4,287 4,544 4,817 5,412 5,737 1,20 Total Operating Expenses 5,450 24,966 0 12,473 16,509 18,387 19,784 20,970 22,215 23,552 Operating Profit 3,314 -1,201 0 550 887 1,71 3,048 2,937 3,114 3,509 3,719 Working Capital Assumptions 3.0% 3.0% 3.0% 3.0% 3.0% 3.0% Minimum Cash Balance as % of Sales 3.0% 3.0% 3.0% Days Sales Outstanding 59.2x 59.2x 59.2x 59.2x 59.2x 59.2x 59.2x 59.2x 59.2x 12.2x 12.3x 12,6x 12.7x 12.7x 12.7x Inventory Turnover (prod. cost/ending inv.) 12.7x 12.7x 12.7x Days Payable Outstanding (based on tot. op. exp.) 33.9x 33.9x 33.9x 33.7x 33.8x 33.9x 33.9x 33.9x 33.9x Capital Expenditures 4,610 0 310 310 2,060 820 870 910 950 960 960 New Heritage Doll Company: Capital Budgeting Exhibit 2 Selected Operating Projections for Design Your Own Doll 2010 2012 2017 2011 2013 2014 2015 2016 2018 2019 2020 21,435 22,721 27,061 Revenue 0 6,000 13,360 18,220 24,084 25,529 28,685 17.6% Revenue Growth 122.7% 36.4% 6.0% 6.0% 6.0% 6.0% 6.0% Production Costs 1,650 1,690 1,830 1,854 1,895 Fixed Production Expense (excl depreciation) 0 1,728 1,755 1,795 1,933 Variable Production Costs 0 2,250 7,551 10,427 11,909 12,983 13,833 14,736 15,694 16,712 Depreciation 0 310 310 310 436 462 490 520 551 584 18,140 Total Production Costs 0 4,210 9,55 12,465 14,100 15,240 16,153 17,109 19,229 5,106 Selling, General & Administrative 1,201 0 1,240 2,922 4,044 4,287 4,544 4,817 5,412 5,737 1,20 Total Operating Expenses 5,450 24,966 0 12,473 16,509 18,387 19,784 20,970 22,215 23,552 Operating Profit 3,314 -1,201 0 550 887 1,71 3,048 2,937 3,114 3,509 3,719 Working Capital Assumptions 3.0% 3.0% 3.0% 3.0% 3.0% 3.0% Minimum Cash Balance as % of Sales 3.0% 3.0% 3.0% Days Sales Outstanding 59.2x 59.2x 59.2x 59.2x 59.2x 59.2x 59.2x 59.2x 59.2x 12.2x 12.3x 12,6x 12.7x 12.7x 12.7x Inventory Turnover (prod. cost/ending inv.) 12.7x 12.7x 12.7x Days Payable Outstanding (based on tot. op. exp.) 33.9x 33.9x 33.9x 33.7x 33.8x 33.9x 33.9x 33.9x 33.9x Capital Expenditures 4,610 0 310 310 2,060 820 870 910 950 960 960