Question
1. What do these visualizations show?2. How might these observations affect our risk assessment? The audit manager has informed you that the following risk of
1. What do these visualizations show?2. How might these observations affect our risk assessment?

The audit manager has informed you that the following risk of material misstatement (RoMM) related to the valuation assertion associated with the investments has been identified: Assumptions, inputs, or methods used to determine the fair value of the security are inappropriate on the basis of assumptions or observable or unobservable inputs in the marketplace and are significant to the valuation (Level 2 securities). [RoMM #1]
In addition, the following risk of material misstatement related to the disclosure and presentation of has been identified:The Company?s classification of securities is inconsistent with the fair value hierarchy (e.g., it classifies a security as Level 2 rather than Level 3). [RoMM #2]

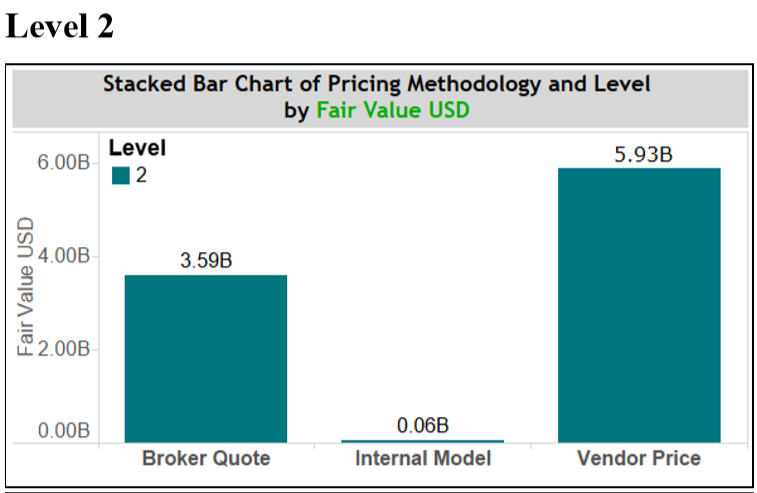
This bar chart is visual representations of the pricing methods for Level 2 securities. (Level 2 in Fair Value Hierarchy)
Level 2 securities (Debt Securities) Agency Residential mortgage-backed Mortgage-backed Asset-backed Corporate debt Book value $ 5,979 866 306 707 1,543 Unreal Gains $98 13 1 4 35 Unreal Losses $ (1) (5) (1) (1) (3) Fair value $ 6,076 874 307 710 1,575 Level 2 Fair Value USD 6.00B- 4.00B- 2.00B- 0.00B Stacked Bar Chart of Pricing Methodology and Level by Fair Value USD Level 2 3.59B Broker Quote 0.06B Internal Model 5.93B Vendor Price
Step by Step Solution
3.42 Rating (155 Votes )
There are 3 Steps involved in it
Step: 1
1 These visualizations show the fair values of the level 1 and level 2 securities using a broker quo...
Get Instant Access to Expert-Tailored Solutions
See step-by-step solutions with expert insights and AI powered tools for academic success
Step: 2

Step: 3

Ace Your Homework with AI
Get the answers you need in no time with our AI-driven, step-by-step assistance
Get Started


