Answered step by step
Verified Expert Solution
Question
1 Approved Answer
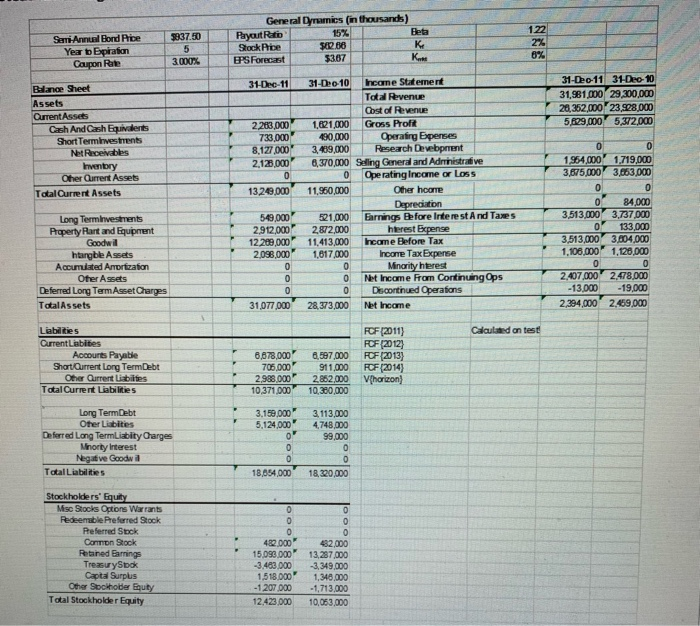
1. What was general dynamics effective tax rate in 2011? 2. Given the previous values you calculated, what is the WACC for General Dynamics? Remember

1. What was general dynamics effective tax rate in 2011?
2. Given the previous values you calculated, what is the WACC for General Dynamics? Remember that if you couldn't solve one of the prior questions, assume a value for it and plug it in to solve for the WACC. Just list any assumptions.
3837.50 5 3.000% Semi Annual Bond Rice Yea b Espiration Carpon Rate General Dynamics (in thousands) Payout Rito 15% Stockice 2.68 PPS Forecast $3.67 K 122 2% 8% K. 31-Dec-11 31-Dec-11 31-Dec-10 31,981,000 29,300,000 28,352,000 23,908,000 5.829,000 5,372,000 Balance Sheet Assets Qurrent Assets Cash And Cash Equivalents Short Terminvestments NetReceivables Inventory Other Current Assets Total Current Assets 2 283,000 733,000 8,127,000 2,128,000 0 13249,000 31-Dec-10 Income Statement Total Revenue Cost of Revenue 1,621,000 Gross Profit 490,000 Operating Expenses 3,489,000 Research Devebprent 6,370,000 Seling General and Administrative 0 Operating Income or Loss 11,950,000 Other home Depreciation 521,000 Earnings Before Interest And Taxes 2,872,000 hterest Expense 11,413,000 Income Before Tax 1,617,000 Income Tax Expense 0 Minority hterest 0 Net Income From Continuing Ops 0 Discontinued Operations 28,373,000 Net Income 0 Long Terminvestments Property Rart and Equipment Goodwill htargble Assets Accumulated Anortization Other Assets Deferred Long Term Asset Charges Total Assets 549,000 2,912,000 12 289,000 2,098,000 0 0 0 31,077,000 0 0 1954,000 1,719,000 3,675,000 3,663,000 0 0 84,000 3,513,000 3,737,000 0 133,000 3,513,000 3,604,000 1.100.000 1,120.000 0 0 2,407,000 2.478,000 -13.000 -19,000 2,294,000 2,459,000 Calculated on test Liabilities Current Liabilities Acourts Payable Short Current Long Term Debt Other Current liabilites Total Current Liabilities 6,678,000 705,000 2,988,000 10,371.000 6,597,000 911,000 2.852,000 10,380,000 FCF (2011) FCF (2012) FCF (2013) FCF (2014) Vhorizon Long Term Debt Other Liabites Deferred Long Term Liabity Charges Minority interest Negative Goodwid Total Liabilities 3.159.000 5,124.000 0 0 0 18,654,000 3,113,000 4,748,000 99,000 0 0 18,320,000 0 O Stockholders' Equity Mise Stocks Options Warrants Pedeemable Preferred Stock Preferred Sock Common Stock Retained Earnings Treasury Sook Capital Surplus Other Sockholder Buty Total Stockholder Equity 0 0 0 482.000 15.090.000 -3.483.000 1.518,000 -1207.000 12.423.000 0 482,000 13,287,000 -3,349,000 1,340.000 -1,713,000 10,063,000 3837.50 5 3.000% Semi Annual Bond Rice Yea b Espiration Carpon Rate General Dynamics (in thousands) Payout Rito 15% Stockice 2.68 PPS Forecast $3.67 K 122 2% 8% K. 31-Dec-11 31-Dec-11 31-Dec-10 31,981,000 29,300,000 28,352,000 23,908,000 5.829,000 5,372,000 Balance Sheet Assets Qurrent Assets Cash And Cash Equivalents Short Terminvestments NetReceivables Inventory Other Current Assets Total Current Assets 2 283,000 733,000 8,127,000 2,128,000 0 13249,000 31-Dec-10 Income Statement Total Revenue Cost of Revenue 1,621,000 Gross Profit 490,000 Operating Expenses 3,489,000 Research Devebprent 6,370,000 Seling General and Administrative 0 Operating Income or Loss 11,950,000 Other home Depreciation 521,000 Earnings Before Interest And Taxes 2,872,000 hterest Expense 11,413,000 Income Before Tax 1,617,000 Income Tax Expense 0 Minority hterest 0 Net Income From Continuing Ops 0 Discontinued Operations 28,373,000 Net Income 0 Long Terminvestments Property Rart and Equipment Goodwill htargble Assets Accumulated Anortization Other Assets Deferred Long Term Asset Charges Total Assets 549,000 2,912,000 12 289,000 2,098,000 0 0 0 31,077,000 0 0 1954,000 1,719,000 3,675,000 3,663,000 0 0 84,000 3,513,000 3,737,000 0 133,000 3,513,000 3,604,000 1.100.000 1,120.000 0 0 2,407,000 2.478,000 -13.000 -19,000 2,294,000 2,459,000 Calculated on test Liabilities Current Liabilities Acourts Payable Short Current Long Term Debt Other Current liabilites Total Current Liabilities 6,678,000 705,000 2,988,000 10,371.000 6,597,000 911,000 2.852,000 10,380,000 FCF (2011) FCF (2012) FCF (2013) FCF (2014) Vhorizon Long Term Debt Other Liabites Deferred Long Term Liabity Charges Minority interest Negative Goodwid Total Liabilities 3.159.000 5,124.000 0 0 0 18,654,000 3,113,000 4,748,000 99,000 0 0 18,320,000 0 O Stockholders' Equity Mise Stocks Options Warrants Pedeemable Preferred Stock Preferred Sock Common Stock Retained Earnings Treasury Sook Capital Surplus Other Sockholder Buty Total Stockholder Equity 0 0 0 482.000 15.090.000 -3.483.000 1.518,000 -1207.000 12.423.000 0 482,000 13,287,000 -3,349,000 1,340.000 -1,713,000 10,063,000Step by Step Solution
There are 3 Steps involved in it
Step: 1

Get Instant Access to Expert-Tailored Solutions
See step-by-step solutions with expert insights and AI powered tools for academic success
Step: 2

Step: 3

Ace Your Homework with AI
Get the answers you need in no time with our AI-driven, step-by-step assistance
Get Started


