

Question
1. Which of the following graphs(a&b) represents the data more accurately? Why? 2. Which of the following graphs (a&b) represents the data more accurately? Why?
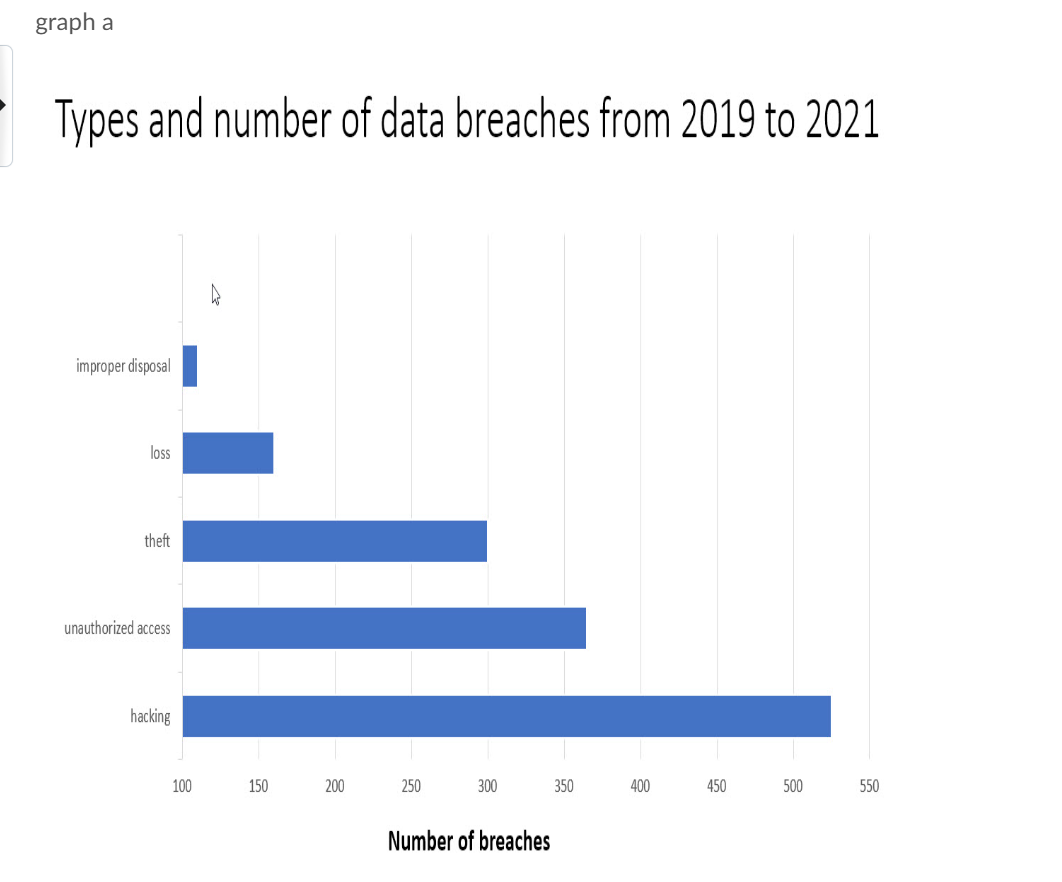
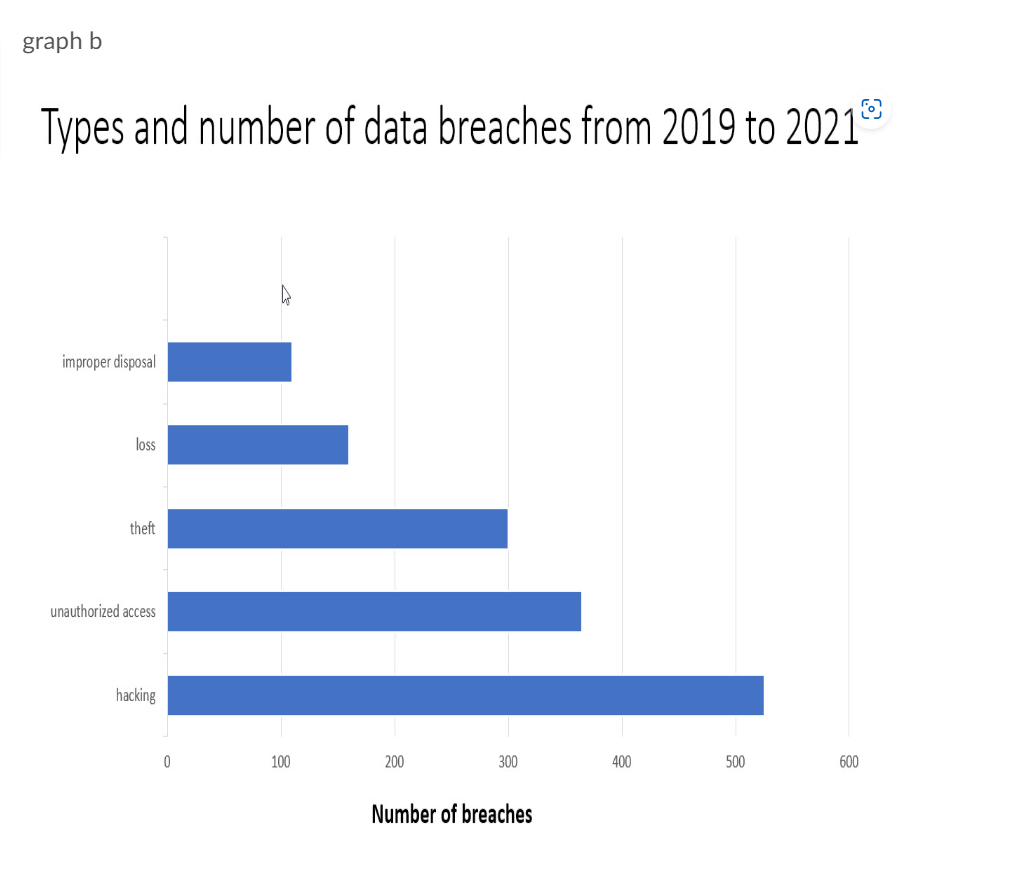
1. Which of the following graphs(a&b) represents the data more accurately? Why?
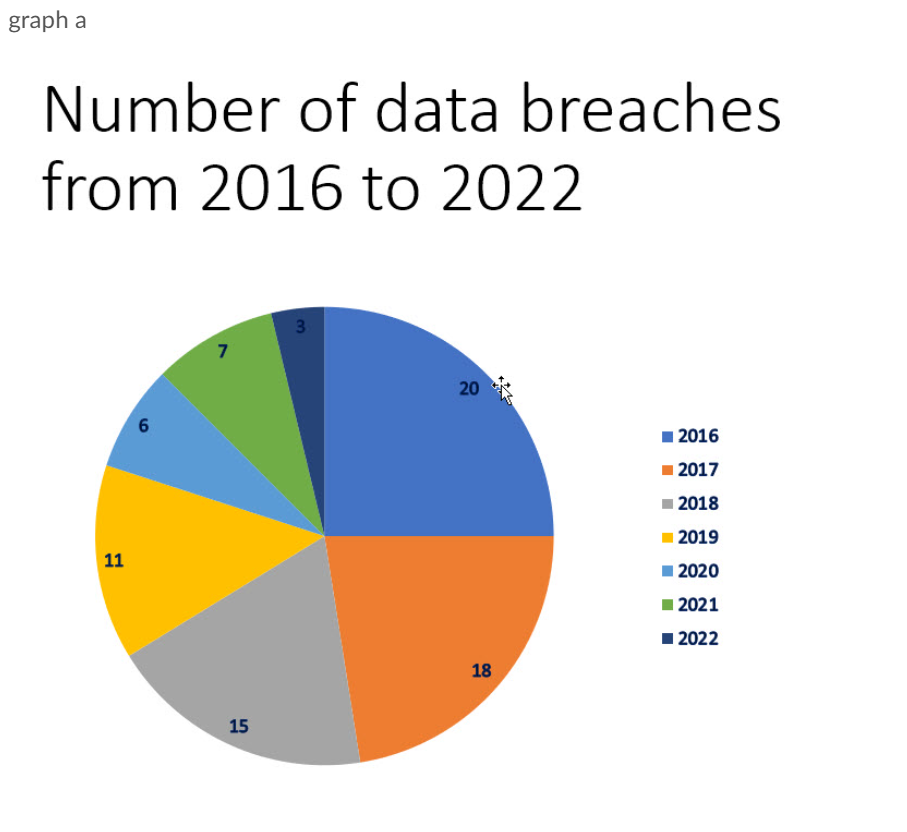
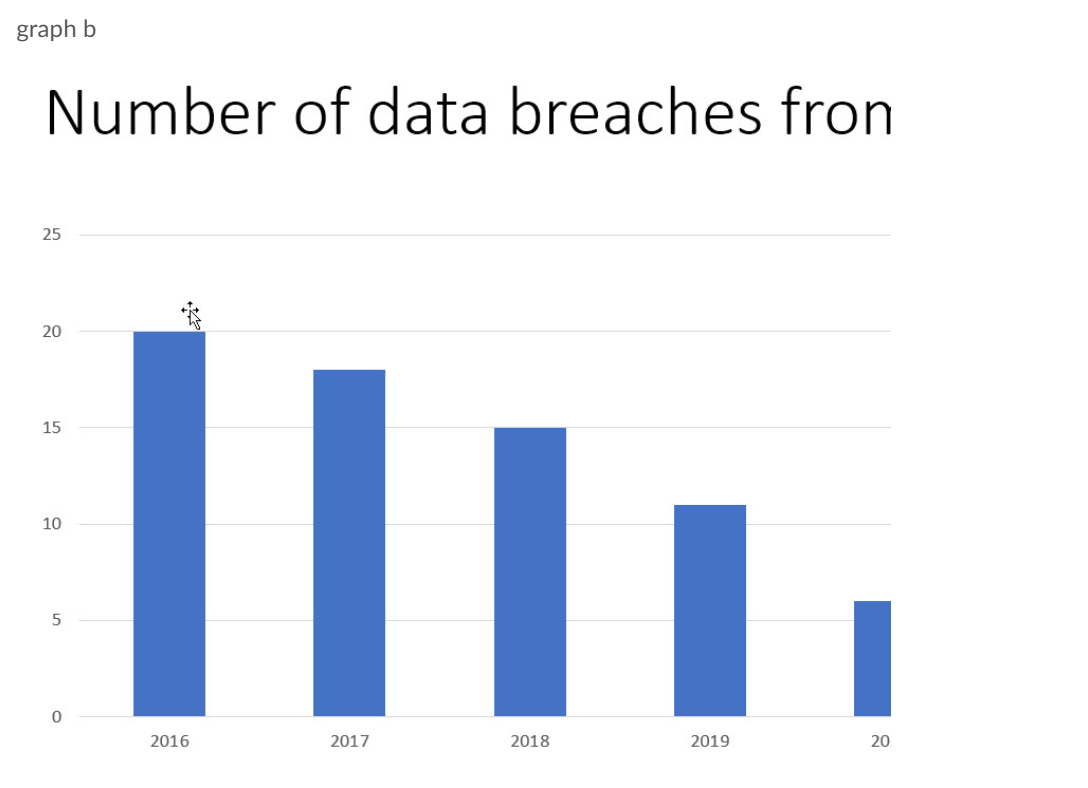
2. Which of the following graphs (a&b) represents the data more accurately? Why?
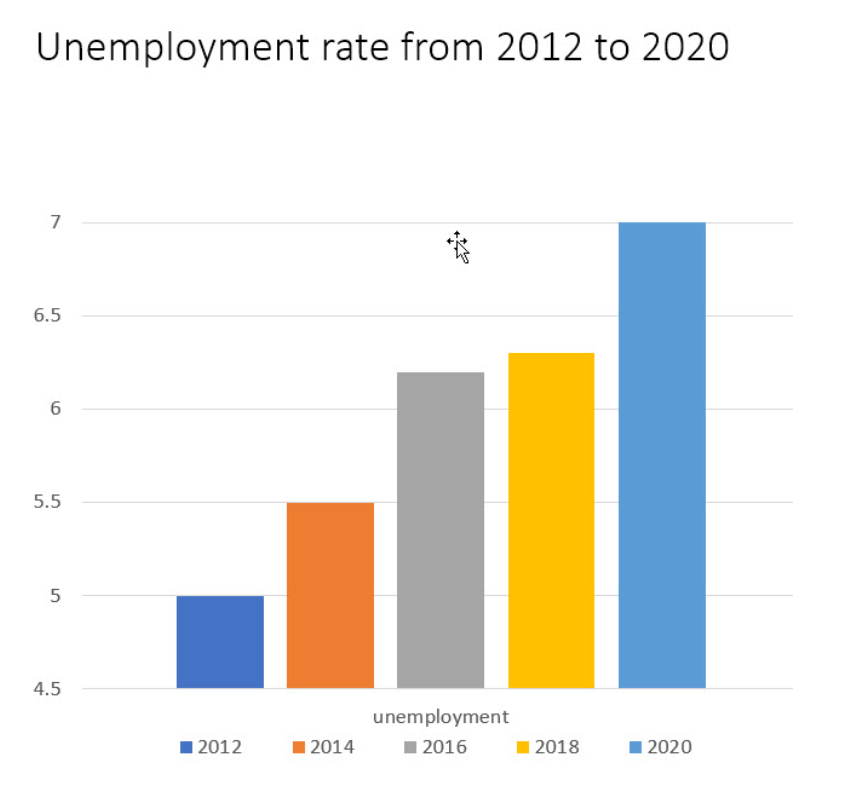
3. The following graph is deceiving. Why is it deceiving, and how would you improve it?
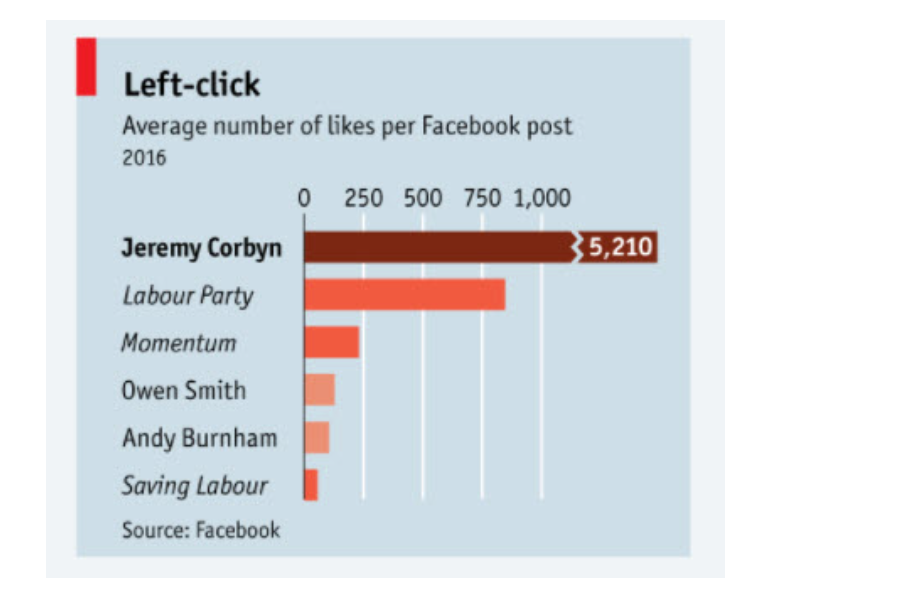
4. The following chart shows the average number of Facebook likes that a group of British politicians received. However, the chart could illustrate the data more accurately? Why is it not accurate, and how would you improve it?
QUESTION1
Step by Step Solution
There are 3 Steps involved in it
Step: 1

Get Instant Access to Expert-Tailored Solutions
See step-by-step solutions with expert insights and AI powered tools for academic success
Step: 2

Step: 3
Ace Your Homework with AI
Get the answers you need in no time with our AI-driven, step-by-step assistance
Get Started
Calculus
Authors: Dale Varberg, Edwin J. Purcell, Steven E. Rigdon
9th edition
131429248, 978-0131429246