Answered step by step
Verified Expert Solution
Question
1 Approved Answer
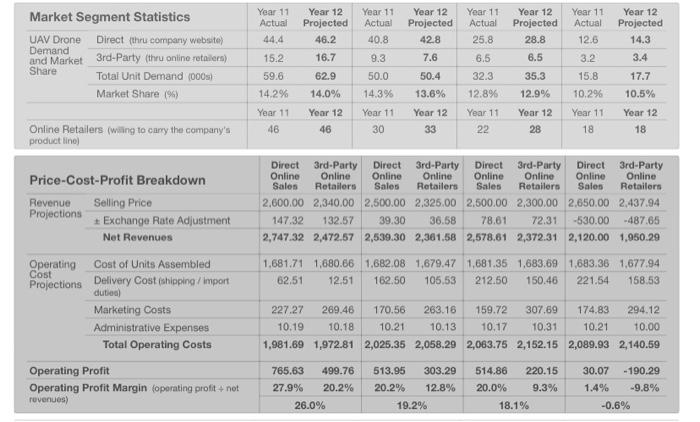
1. Write the Performance Target Forecasting 2. Give the review of financial performance: Annual Total Revenues Earnings Per Share (EPS) Return on Equity (ROE) Annual
1. Write the Performance Target Forecasting
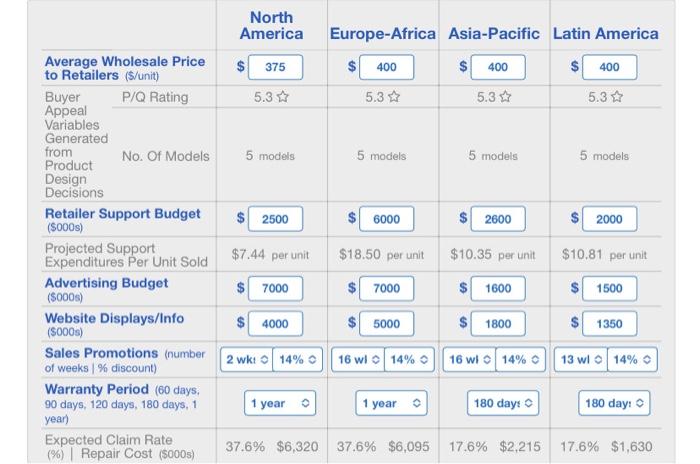
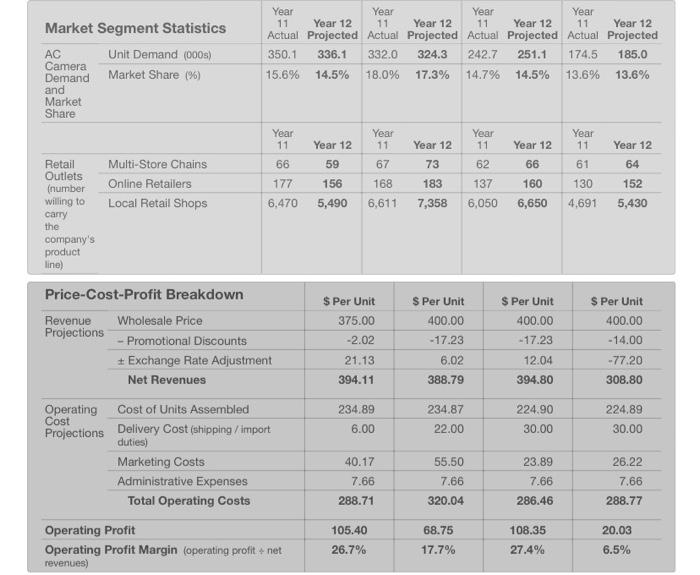
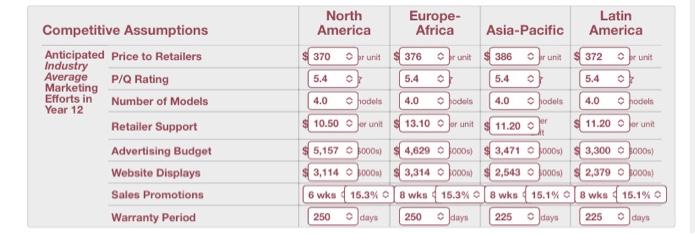
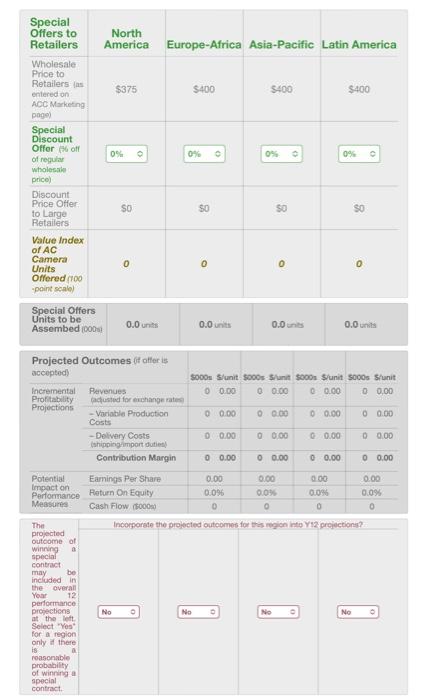
PROJECTED Y12 PERFORMANCE Scoring Measures Earnings Per Share Return On Equity Credit Rating Image Rating Investor Year 12 Expect. $5.08 $8.50 11.9% 42.5% A+ A 78 77 Change Other Measures Year 12 from 911 Net Revenues (5000s) 836,287 -5.8% Net Profit ($000s) 121,801 -6.5 Ending Cash (5000s) 922,743 +124,711 North America Europe-Africa Asia-Pacific Latin America Average Wholesale Price $ 375 $ 400 $ 400 $ 400 to Retailers ($/unit) Buyer P/Q Rating 5.3 5.3 * 5.3 * 5.3 Appeal Variables Generated from No. of Models 5 models 5 models 5 models 5 models Product Design Decisions Retailer Support Budget $ 2500 $ 6000 $ 2600 $ 2000 (5000s) Projected Support $7.44 per unit $18.50 per unit $10.35 per unit $10.81 per unit Expenditures Per Unit Sold Advertising Budget $ 7000 $ 7000 $ 1600 $ 1500 (5000) Website Displays/Info $ 4000 5000 $ 1800 $ 1350 (5000s) Sales Promotions (number 2 wkt 14% 16 wl 14% 16 I 14% 13 wlo 14% of weeks 1 % discount) Warranty Period (60 days, 90 days, 120 days, 180 days, 1 1 year 1 year 180 day: 180 day: year) Expected Claim Rate 37.6% $6,320 37.6% $6,095 17.6% $2,215 17.6% $1,630 (%) Repair Cost (5000s) Market Segment Statistics AC Unit Demand (000) Camera Demand Market Share (%) Year Year Year Year 11 Year 12 11 Year 12 11 Year 12 11 Year 12 Actual Projected Actual Projected Actual Projected Actual Projected 350.1 336.1 332.0 324.3 242.7 251.1 174.5 185.0 15.6% 14.5% 18.0% 17.3% 14.7% 14.5% 13.6% 13.6% and Market Share Year 11 Year 11 Year 11 Year 11 66 67 Multi-Store Chains Online Retailers Local Retail Shops Year 12 59 156 5,490 Year 12 73 183 7,358 62 137 Year 12 66 160 6,650 61 130 Year 12 64 152 5,430 177 168 6,470 6,611 6,050 4.691 Retail Outlets (number Willing to carry the company's product line) S Per Unit $ Per Unit Price-Cost-Profit Breakdown Revenue Wholesale Price Projections - Promotional Discounts + Exchange Rate Adjustment Net Revenues $ Per Unit 375.00 -2.02 S Per Unit 400.00 -17.23 400.00 -17.23 400.00 - 14.00 -77.20 6.02 21.13 394.11 12.04 394.80 388.79 308.80 234.89 234.87 224.90 30.00 224.89 30.00 6.00 22.00 Operating cost of Units Assembled Cost Projections Delivery Cost (shipping/import duties) Marketing Costs Administrative Expenses Total Operating costs 40.17 23.89 7.66 55.50 7.66 320.04 7.66 286.46 26.22 7.66 288.77 288.71 68.75 Operating Profit Operating Profit Margin (operating profit.net revenues) 105.40 26.7% 108.35 27.4% 20.03 6.5% 17.7% North America Europe- Africa Asia-Pacific Latin America 376 unit 372 unt Competitive Assumptions Anticipated Price to Retailers Industry Average P/Q Rating Marketing Efforts in Number of Models Year 12 Retailer Support Advertising Budget Website Displays Sales Promotions Warranty Period unit 370 brunit 386 or unit 5.4 5.4 5.4 5.40 4.0 hodels 4.0 fodels 4.0 chodels 4.0 podiel 10.50 for unit 13.10 for unit 11.20 er 11.20 5,157 000 $4,629 000 3,471 2000 3,300 000) 3,114 000 3,314 000 2,543 000) 2,379000W 6 wks 15.3% 8 wks - 15.3% 8 wks 15.1% 8 wka days North America Europe Africa Asia-Pacific Latin America $375 $400 5400 $400 Special Offers to Retailers Wholesale Price to Retailers entered on ACC Marketing page Special Discount Offer off of regular wholesale price) Discount Price Offer to Large Retailers Value Index of AC Camera Units Offered (100 point scale) 0% 0% 0% 09 SO SO so 50 0 0 0 o Special Offers Units to be Assembed 000 0.0 units 0.0 units 0.0 units 0.0 units Projected Outcomes Gt offer is accepted) Soos Slunit 8000 Sunit soos Sunit S000s S'unit Incremental Revenues 0 0.00 0 0.00 00.00 0 0.00 Profitability adosted for exchange rates Projections - Variable Production 0 0.00 00.00 0 0.00 0 0.00 Costs - Delivery Costs 0 0.00 0 0.00 00.00 0 0.00 shipping import dut Contribution Margin 0 0.00 0 0.00 0 0.00 0 0.00 Potential Earnings Per Share 0.00 0.00 000 0.00 Impact on Performance Return On Equity 0.096 0.0% 0.096 0.09 Measures Cash Flow 5000 D o 0 0 The Incorporate the projected outcomes for this region to Y12 projections? projected outcome of winning a special contract may be included in the Overall You 12 performance projections No No . No at the left No Select Yes for a region only there is a reasonable probability of winning special contract 2. Give the review of financial performance:
Annual Total Revenues
Earnings Per Share (EPS)
Return on Equity (ROE)
Annual Credit Ratings
Annual Image Rating
Year End Stock Price 



Step by Step Solution
There are 3 Steps involved in it
Step: 1

Get Instant Access to Expert-Tailored Solutions
See step-by-step solutions with expert insights and AI powered tools for academic success
Step: 2

Step: 3

Ace Your Homework with AI
Get the answers you need in no time with our AI-driven, step-by-step assistance
Get Started


