Question
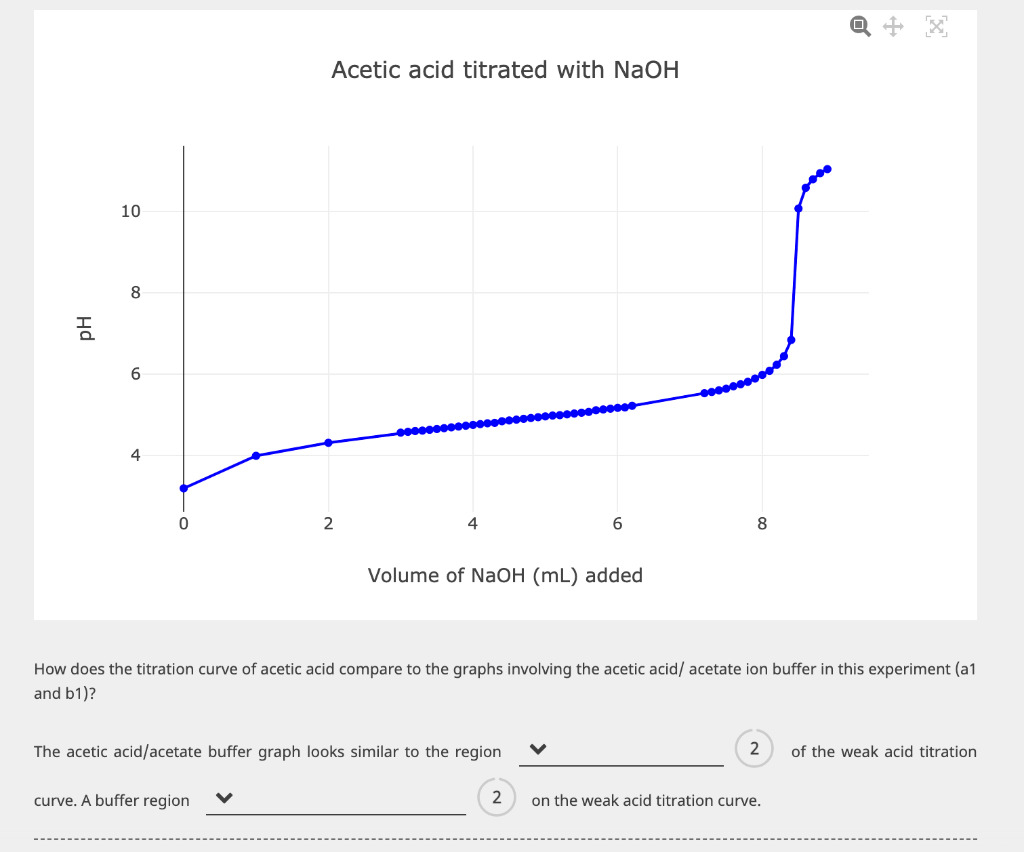
10 8 01 6 4 0 Acetic acid titrated with NaOH 2 curve. A buffer region Volume of NaOH (mL) added The acetic acid/acetate

10 8 01 6 4 0 Acetic acid titrated with NaOH 2 curve. A buffer region Volume of NaOH (mL) added The acetic acid/acetate buffer graph looks similar to the region 6 How does the titration curve of acetic acid compare to the graphs involving the acetic acid/ acetate ion buffer in this experiment (a1 and b1)? 2 8 2 on the weak acid titration curve. of the weak acid titration
Step by Step Solution
3.47 Rating (160 Votes )
There are 3 Steps involved in it
Step: 1
16 5 In the aletic acid Vs NaOH Titation curve Buffer region is at pH 376 to 576 shown ...
Get Instant Access to Expert-Tailored Solutions
See step-by-step solutions with expert insights and AI powered tools for academic success
Step: 2

Step: 3

Ace Your Homework with AI
Get the answers you need in no time with our AI-driven, step-by-step assistance
Get StartedRecommended Textbook for
Chemistry The Central Science
Authors: Theodore Brown, Eugene LeMay, Bruce Bursten, Catherine Murphy, Patrick Woodward
12th edition
321696727, 978-0132175081, 978-0321696724
Students also viewed these Chemistry questions
Question
Answered: 1 week ago
Question
Answered: 1 week ago
Question
Answered: 1 week ago
Question
Answered: 1 week ago
Question
Answered: 1 week ago
Question
Answered: 1 week ago
Question
Answered: 1 week ago
Question
Answered: 1 week ago
Question
Answered: 1 week ago
Question
Answered: 1 week ago
Question
Answered: 1 week ago
Question
Answered: 1 week ago
Question
Answered: 1 week ago
Question
Answered: 1 week ago
Question
Answered: 1 week ago
Question
Answered: 1 week ago
Question
Answered: 1 week ago
Question
Answered: 1 week ago
Question
Answered: 1 week ago
Question
Answered: 1 week ago
Question
Answered: 1 week ago
Question
Answered: 1 week ago
Question
Answered: 1 week ago
Question
Answered: 1 week ago
View Answer in SolutionInn App


