Question
10. Annual Compounding. The following table shows annual sales data for Stuff Happens, Inc., over the ten- year 1998-2008 period: Year 1998 1999 2000

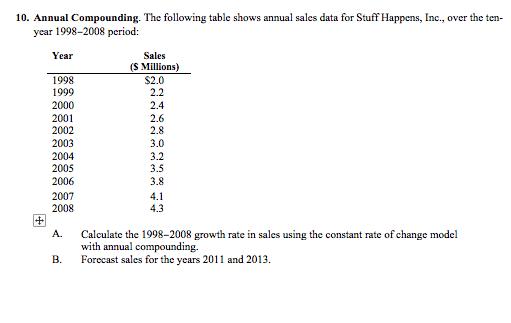
10. Annual Compounding. The following table shows annual sales data for Stuff Happens, Inc., over the ten- year 1998-2008 period: Year 1998 1999 2000 2001 2002 2003 2004 2005 2006 2007 2008 A. B. Sales (S Millions) $2.0 2.2 2.4 2.6 2.8 3.0 3.2 3.5 3.8 4.1 4.3 Calculate the 1998-2008 growth rate in sales using the constant rate of change model with annual compounding. Forecast sales for the years 2011 and 2013.
Step by Step Solution
3.42 Rating (155 Votes )
There are 3 Steps involved in it
Step: 1
To calculate the growth rate in sales for the period 19982008 using the constant rate of change mode...
Get Instant Access to Expert-Tailored Solutions
See step-by-step solutions with expert insights and AI powered tools for academic success
Step: 2

Step: 3

Ace Your Homework with AI
Get the answers you need in no time with our AI-driven, step-by-step assistance
Get StartedRecommended Textbook for
Accounting Information Systems
Authors: Vernon Richardson, Chengyee Chang, Rod Smith
2nd edition
1260153156, 1260153150, 978-1260153156
Students also viewed these Accounting questions
Question
Answered: 1 week ago
Question
Answered: 1 week ago
Question
Answered: 1 week ago
Question
Answered: 1 week ago
Question
Answered: 1 week ago
Question
Answered: 1 week ago
Question
Answered: 1 week ago
Question
Answered: 1 week ago
Question
Answered: 1 week ago
Question
Answered: 1 week ago
Question
Answered: 1 week ago
Question
Answered: 1 week ago
Question
Answered: 1 week ago
Question
Answered: 1 week ago
Question
Answered: 1 week ago
Question
Answered: 1 week ago
Question
Answered: 1 week ago
Question
Answered: 1 week ago
Question
Answered: 1 week ago
Question
Answered: 1 week ago
Question
Answered: 1 week ago
Question
Answered: 1 week ago
Question
Answered: 1 week ago
View Answer in SolutionInn App


