

Answered step by step
Verified Expert Solution
Question
1 Approved Answer
10. Given the financial statements provided in the appendix for Ford Motors Inc and Tesla Inc: i. Calculate the cash conversion cycle for Ford and
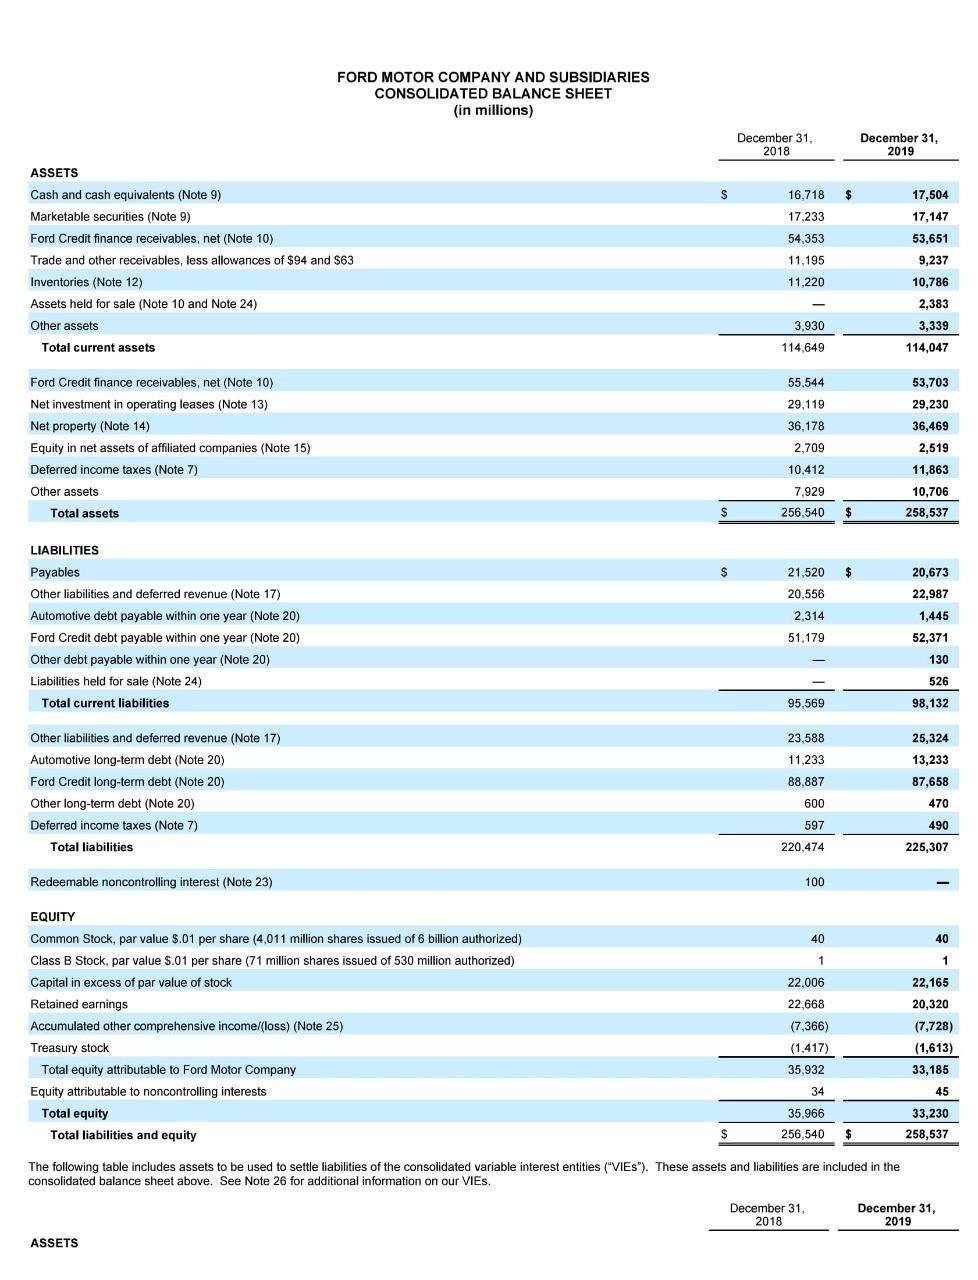
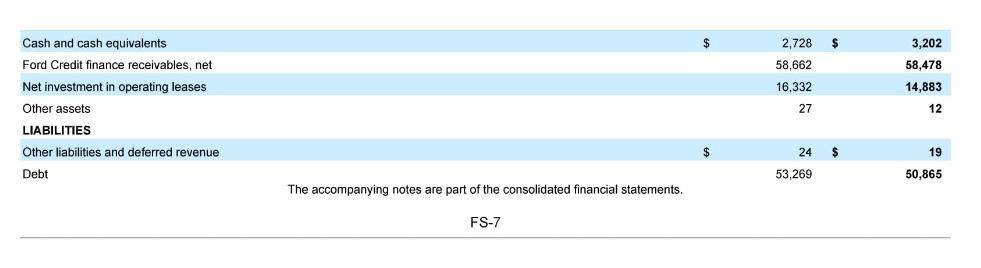
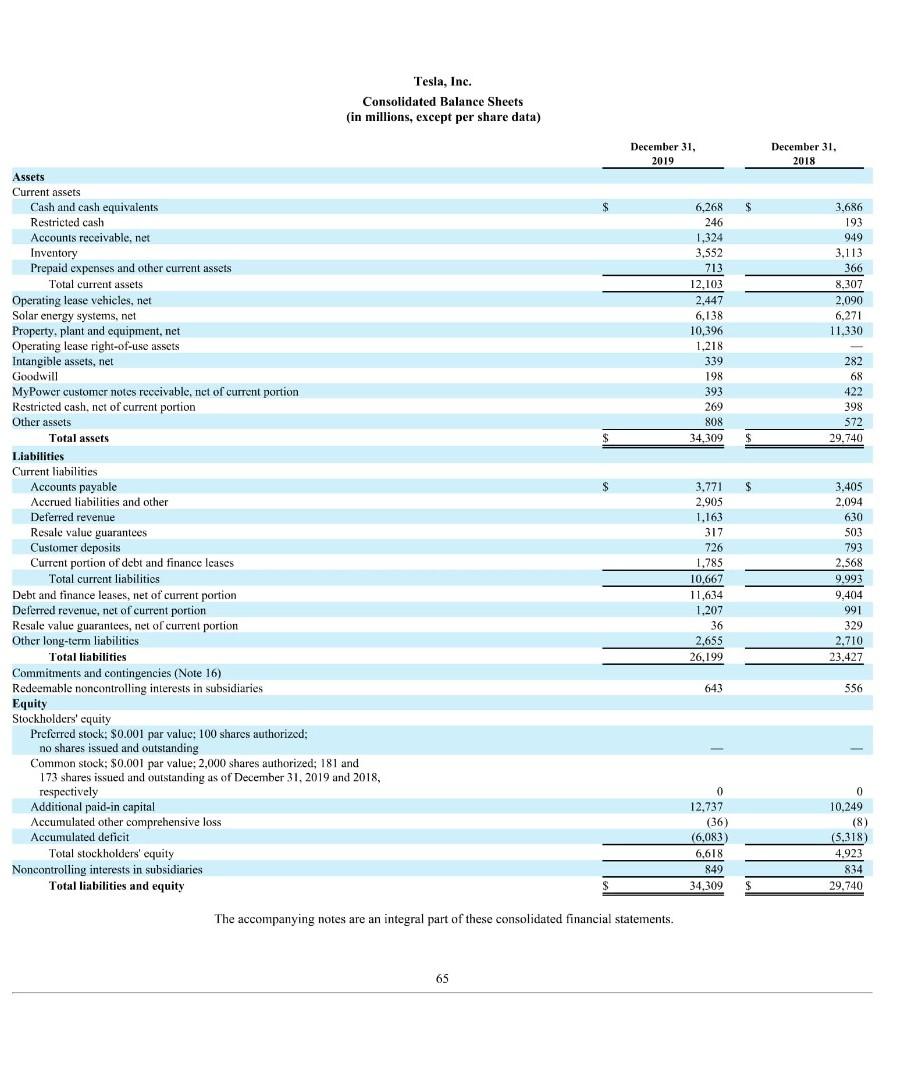
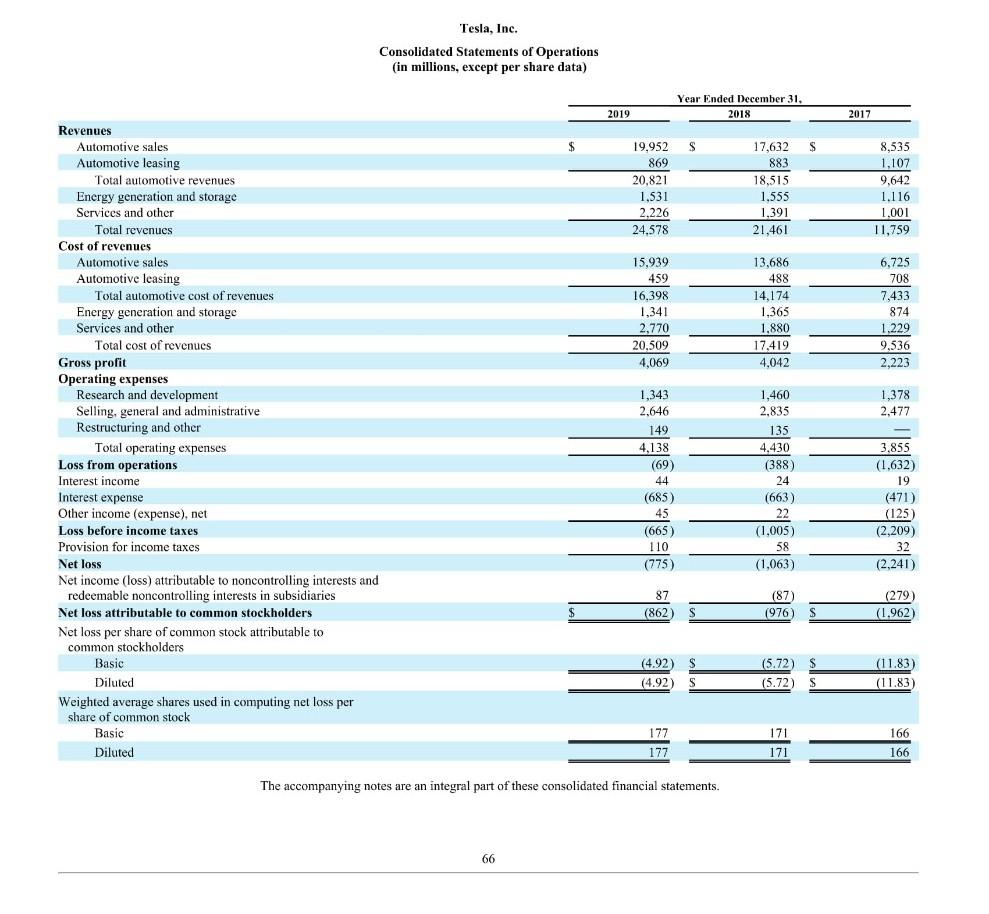
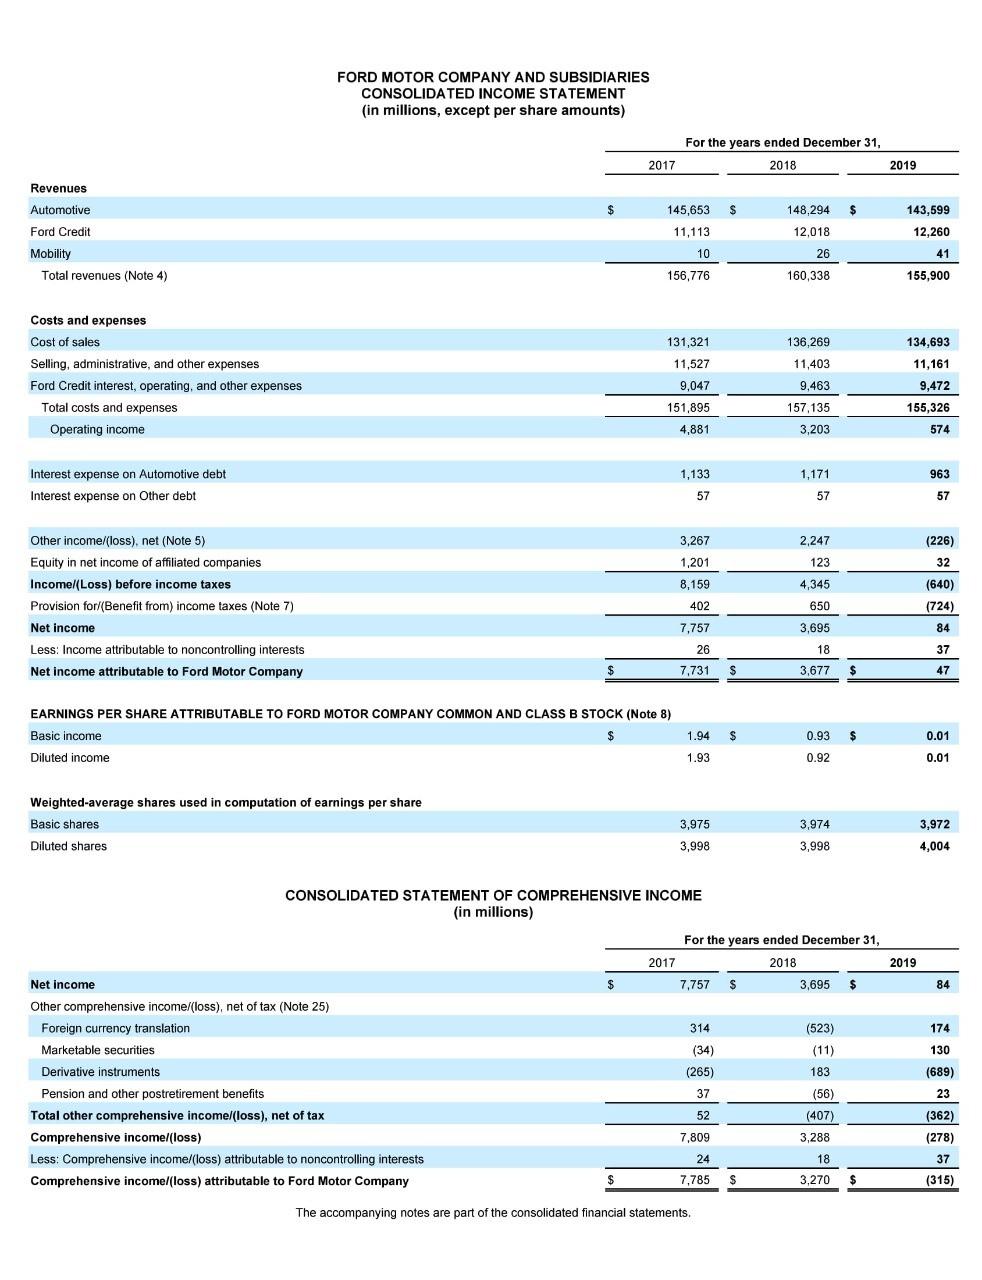
10. Given the financial statements provided in the appendix for Ford Motors Inc and Tesla Inc: i. Calculate the cash conversion cycle for Ford and Tesla's cars for the most recent period. Assume 365-day per year and use average' balance whenever possible. (5 marks each) 11. Which company has a better' cash conversion cycle in the recent period? Explain. (5 marks) 111. Compute and compare Ford and Tesla's changes in operating working capital (OWC) for the latest two years and comment (assume that the detailed 'notes' are not available, and you are asked to use your judgment when evaluating both balance sheets. (5 marks each) FORD MOTOR COMPANY AND SUBSIDIARIES CONSOLIDATED BALANCE SHEET (in millions) December 31, 2018 December 31, 2019 $ 16.718 $ 17,233 54,353 17,504 17,147 53,651 ASSETS Cash and cash equivalents (Note 9) Marketable securities (Note 9) Ford Credit finance receivables, net (Note 10) Trade and other receivables, less allowances of $94 and $63 Inventories (Note 12) Assets held for sale (Note 10 and Note 24) Other assets Total current assets 9,237 11,195 11.220 10,786 2,383 3,339 3,930 114,649 114,047 53,703 Ford Credit finance receivables, net (Note 10) Net investment in operating leases (Note 13) Net property (Note 14) Equity in net assets of affiliated companies (Note 15) Deferred income taxes (Note 7) Other assets Total assets 55,544 29.119 36,178 2,709 10,412 7.929 29,230 36,469 2,519 11,863 10,706 258,537 $ 256,540 $ $ $ 21,520 20,556 2.314 20,673 22,987 LIABILITIES Payables Other liabilities and deferred revenue (Note 17) Automotive debt payable within one year (Note 20) Ford Credit debt payable within one year (Note 20) Other debt payable within one year (Note 20) Liabilities held for sale (Note 24) Total current liabilities 1,445 52,371 51.179 130 526 95,569 98,132 23.588 25,324 13,233 87,658 Other liabilities and deferred revenue (Note 17) Automotive long-term debt (Note 20) Ford Credit long-term debt (Note 20) Other long-term debt (Note 20) Deferred income taxes (Note 7) 7) Total liabilities 11,233 88,887 600 597 220,474 470 490 225,307 Redeemable noncontrolling interest (Note 23) 100 40 40 1 1 22.006 22,165 20,320 22,668 EQUITY Common Stock, par value $.01 per share (4,011 million shares issued of 6 billion authorized) Class B Stock, par value $.01 per share (71 million shares issued of 530 million authorized) Capital in excess of par value of stock Retained earnings Accumulated other comprehensive income/loss) (Note 25) Treasury stock Total equity attributable to Ford Motor Company Equity attributable to noncontrolling interests Total equity Total liabilities and equity (7,366) (1,417) 35.932 (7,728) (1,613) 33,185 34 45 35,966 256,540 $ 33,230 258,537 $ The following table includes assets to be used to settle liabilities of the consolidated variable interest entities ("VIES"). These assets and liabilities are included in the consolidated balance sheet above. See Note 26 for additional information on our VIEs. December 31 2018 December 31, 2019 ASSETS $ 3,202 Cash and cash equivalents Ford Credit finance receivables, net Net investment in operating leases Other assets 2,728 58,662 16,332 58,478 14,883 27 12 LIABILITIES $ 24 $ 19 Other liabilities and deferred revenue Debt 53,269 50,865 The accompanying notes are part of the consolidated financial statements. FS-7 Tesla, Inc. Consolidated Balance Sheets (in millions, except per share data) December 31, 2019 December 31, 2018 Assets $ 6,268 246 1,324 3,552 713 12,103 2,447 6,138 3,686 193 949 3,113 366 8,307 2,090 6,271 11,330 10,396 1,218 339 198 393 269 808 34,309 282 68 422 398 572 29.740 S S $ $ $ Current assets Cash and cash equivalents Restricted cash Accounts receivable, net Inventory Prepaid expenses and other current assets Total current assets Operating lease vehicles, net Solar energy systems, net Property, plant and equipment, net Operating lease right-of-use assets Intangible assets, net Goodwill MyPower customer notes receivable, nct of current portion Restricted cash, nct of current portion Other assets Total assets Liabilities Current liabilities Accounts payable Accrued liabilities and other Deferred revenue Resale value guarantees Customer deposits Current portion of debt and finance Icases Total current liabilities Debt and finance leases, net of current portion Deferred revenue, net of current portion Resale value guarantees, net of current portion Other long-term liabilities Total liabilities Commitments and contingencies (Note 16) Redeemable noncontrolling interests in subsidiaries Equity Stockholders' equity Preferred stock: $0.001 par valuc: 100 shares authorized: no shares issued and outstanding Common stock; $0.001 par value: 2,000 shares authorized; 181 and 173 shares issued and outstanding as of December 31, 2019 and 2018, respectively Additional paid-in capital Accumulated other comprehensive loss Accumulated deficit Total stockholders' equity Noncontrolling interests in subsidiaries Total liabilities and equity 3,771 2,905 1.163 317 726 1,785 10,667 11,634 1,207 36 2,655 26.199 3,405 2.094 630 503 793 2,568 9.993 22 9,404 991 329 2,710 23.427 643 556 0 12.737 (36) (6,083) 6,618 849 34.309 0 10,249 (8) (5,318) 4,923 834 29,740 $ $ The accompanying notes are an integral part of these consolidated financial statements 65 Tesla, Inc. Consolidated Statements of Operations (in millions, except per share data) Year Ended December 31, 2018 2019 2017 $ $ S 19,952 869 20.821 1.531 2.226 24,578 17,632 883 18.515 1.555 1,391 21,461 8,535 1,107 9,642 1.116 1,001 11,759 15,939 459 16,398 1,341 2,770 20.509 4,069 13.686 488 14,174 1,365 1,880 17.419 4,042 6,725 708 7,433 874 1.229 9,536 2,223 1,378 2,477 Revenues Automotive sales Automotive leasing Total automotive revenues Energy generation and storage Services and other Total revenues Cost of revenues Automotive sales Automotive leasing Total automotive cost of revenues Energy generation and storage Services and other Total cost of revenues Gross profit Operating expenses Research and development Selling, general and administrative Restructuring and other Total operating expenses Loss from operations Interest income Interest expense Other income (expense), net Loss before income taxes Provision for income taxes Net loss Net income (loss) attributable to noncontrolling interests and redeemable noncontrolling interests in subsidiaries Net loss attributable to common stockholders Net loss per share of common stock attributable to common stockholders Basic Diluted Weighted average shares used in computing net loss per share of common stock Basic Diluted 1,343 2,646 149 4,138 (69) 44 (685) 45 (665) 110 (775) 1,460 2,835 135 4.430 (388) 24 (663) 22 (1,005) 58 (1,063) 3.855 (1.632) 19 (471) (125) (2,209) 32 (2,241) 87 (862 (87 (976) (279 (1.962 S S (4.92 $ (4.92 S (5.72) $ (5.72) S (11.83) (11.83) 171 177 177 166 166 171 The accompanying notes are an integral part of these consolidated financial statements 66 FORD MOTOR COMPANY AND SUBSIDIARIES CONSOLIDATED INCOME STATEMENT in millions, except per share amounts) For the years ended December 31, 2018 2017 2019 $ 145,653 $ $ 143,599 Revenues Automotive Ford Credit Mobility Total revenues (Note 4) 148,294 12,018 11,113 12,260 10 26 41 156,776 160.338 155,900 131,321 134,693 11,527 11,161 Costs and expenses Cost of sales Selling, administrative, and other expenses Ford Credit interest, operating, and other expenses Total costs and expenses Operating income 9,047 136,269 11,403 9.463 157,135 3,203 9,472 155,326 151,895 4,881 574 1.133 1,171 963 Interest expense on Automotive debt Interest expense on Other debt 57 57 57 3,267 1,201 8,159 2,247 123 Other income/(loss). net (Note 5) Equity in net income of affiliated companies Income (Loss) before income taxes Provision forl(Benefit from) income taxes (Note 7) Net income Less: Income attributable to noncontrolling interests Net income attributable to Ford Motor Company (226) 32 (640) (724) 4.345 402 650 7,757 3,695 84 26 18 37 7,731 $ 3,677 $ 47 EARNINGS PER SHARE ATTRIBUTABLE TO FORD MOTOR COMPANY COMMON AND CLASS B STOCK (Note 8) Basic income $ Diluted income 1.94 $ $ 0.01 0.93 0.92 1.93 0.01 Weighted-average shares used in computation of earnings per share Basic shares Diluted shares 3,974 3,972 3,975 3,998 3,998 4,004 84 174 CONSOLIDATED STATEMENT OF COMPREHENSIVE INCOME (in millions) For the years ended December 31, 2017 2018 2019 Net income $ 7,757 $ 3,695 $ Other comprehensive income/(loss), net of tax (Note 25) Foreign currency translation 314 (523) Marketable securities (34) (11) Derivative instruments (265) 183 Pension and other postretirement benefits 37 (56) Total other comprehensive incomel(loss), net of tax 52 (407) Comprehensive incomel(loss) 7.809 3,288 Less: Comprehensive income/(loss) attributable to noncontrolling interests 24 18 Comprehensive incomel(loss) attributable to Ford Motor Company $ 7,785 $ 3,270 $ 130 (689) 23 (362) (278) 37 (315) The accompanying notes are part of the consolidated financial statements
Step by Step Solution
There are 3 Steps involved in it
Step: 1

Get Instant Access to Expert-Tailored Solutions
See step-by-step solutions with expert insights and AI powered tools for academic success
Step: 2

Step: 3
Ace Your Homework with AI
Get the answers you need in no time with our AI-driven, step-by-step assistance
Get Started
Case Studies in Finance Managing for Corporate Value Creation
Authors: Robert F. Bruner, Kenneth Eades, Michael Schill
7th edition
007786171X, 77861711, 978-0077861711