

Answered step by step
Verified Expert Solution
Question
1 Approved Answer
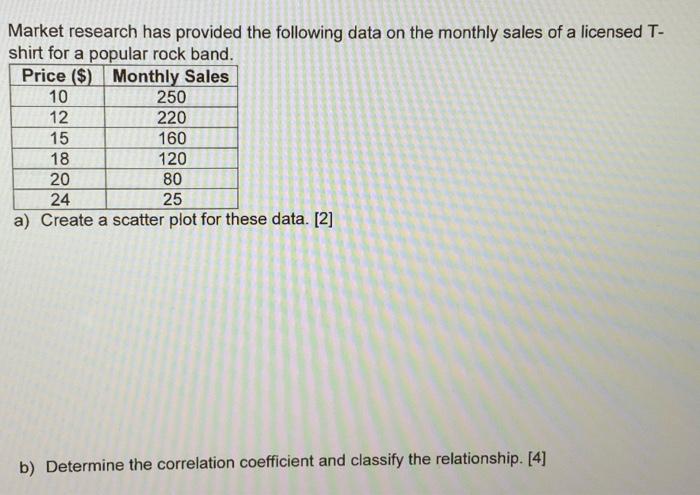
10 Market research has provided the following data on the monthly sales of a licensed T- shirt for a popular rock band. Price ($) Monthly
Step by Step Solution
There are 3 Steps involved in it
Step: 1

Get Instant Access to Expert-Tailored Solutions
See step-by-step solutions with expert insights and AI powered tools for academic success
Step: 2

Step: 3
Ace Your Homework with AI
Get the answers you need in no time with our AI-driven, step-by-step assistance
Get Started
Financial And Managerial Accounting
Authors: Susan F. Haka ,Joseph V. Carcello ,Jan R. Williams
18th Edition
1259922189, 978-1259922183