

Answered step by step
Verified Expert Solution
Question
1 Approved Answer
[10 marks] In your Excel file, column B contains gross monthly percentage returns on a portfolio of US stocks (denoted by ( r p )
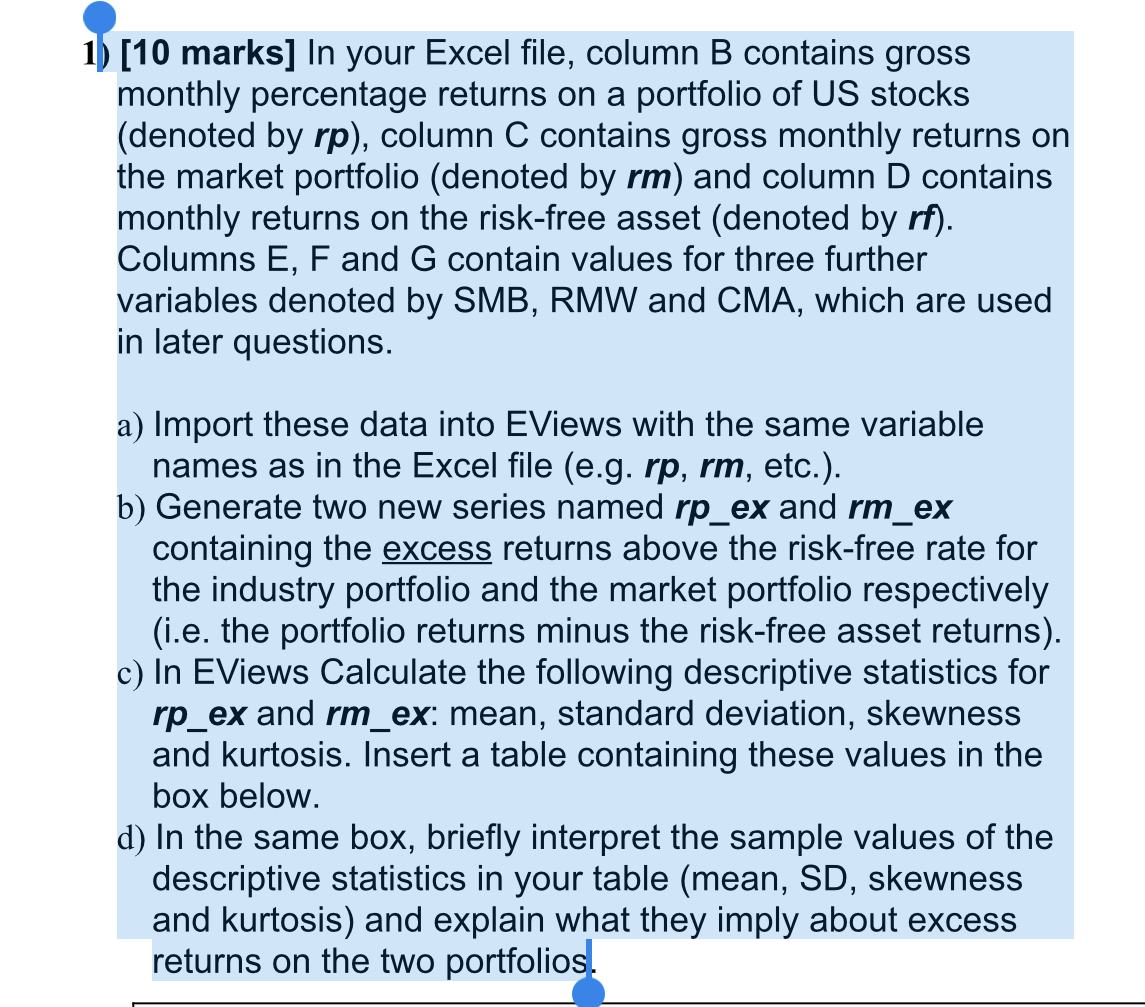 [10 marks] In your Excel file, column B contains gross monthly percentage returns on a portfolio of US stocks (denoted by \\( r p \\) ), column \\( \\mathrm{C} \\) contains gross monthly returns on the market portfolio (denoted by \\( \\mathbf{r m} \\) ) and column D contains monthly returns on the risk-free asset (denoted by \\( \\boldsymbol{r} \\boldsymbol{f} \\) ). Columns \\( \\mathrm{E}, \\mathrm{F} \\) and \\( \\mathrm{G} \\) contain values for three further variables denoted by SMB, RMW and CMA, which are used in later questions. a) Import these data into EViews with the same variable names as in the Excel file (e.g. \\( r p, r m \\), etc.). b) Generate two new series named \\( r p \\_e x \\) and \\( r m_{-} \\)ex containing the excess returns above the risk-free rate for the industry portfolio and the market portfolio respectively (i.e. the portfolio returns minus the risk-free asset returns). c) In EViews Calculate the following descriptive statistics for \\( r p \\_e x \\) and \\( r m \\_e x \\) : mean, standard deviation, skewness and kurtosis. Insert a table containing these values in the box below. d) In the same box, briefly interpret the sample values of the descriptive statistics in your table (mean, SD, skewness and kurtosis) and explain what they imply about excess returns on the two portfolios
 Step by Step Solution
There are 3 Steps involved in it
Step: 1

Get Instant Access to Expert-Tailored Solutions
See step-by-step solutions with expert insights and AI powered tools for academic success
Step: 2

Step: 3
Ace Your Homework with AI
Get the answers you need in no time with our AI-driven, step-by-step assistance
Get Started
Cornerstones Of Financial Accounting
Authors: Bertrand Piccard, Jay Rich, Jeff Jones, Maryanne Mowen, Don Hansen, Nick Jones
1st Edition
0324657730, 9780324657739