Answered step by step
Verified Expert Solution
Question
1 Approved Answer
(10 points) Download the Fast Feet Shoes spreadsheet from Canvas. Using the Scenario Manager, create three scenarios of your own that each vary the three
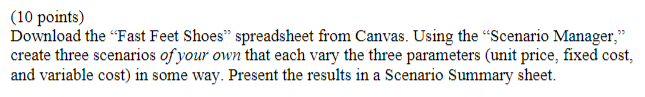
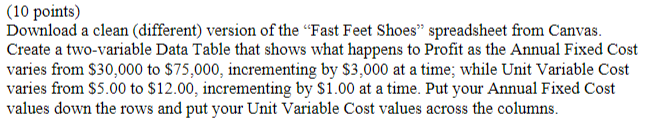
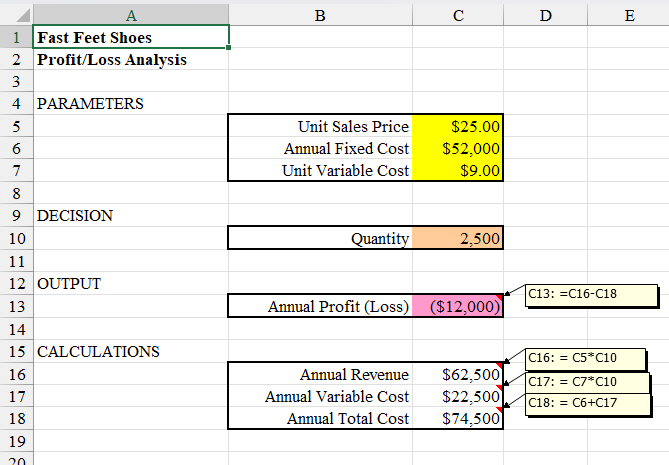
(10 points) Download the "Fast Feet Shoes" spreadsheet from Canvas. Using the "Scenario Manager," create three scenarios of your own that each vary the three parameters (unit price, fixed cost, and variable cost) in some way. Present the results in a Scenario Summary sheet. (10 points) Download a clean (different) version of the "Fast Feet Shoes" spreadsheet from Canvas. Create a two-variable Data Table that shows what happens to Profit as the Annual Fixed Cost varies from $30,000 to $75,000, incrementing by $3,000 at a time; while Unit Variable Cost varies from $5.00 to $12.00, incrementing by $1.00 at a time. Put your Annual Fixed Cost values down the rows and put your Unit Variable Cost values across the columns. \begin{tabular}{|c|c|c|c|} \hline A & B & C & D \\ \hline \multicolumn{4}{|l|}{ Fast Feet Shoes } \\ \hline \multicolumn{4}{|c|}{ Profit/Loss Analysis } \\ \hline \multicolumn{4}{|l|}{ PARAMETERS } \\ \hline & Unit Sales Price & $25.00 & \\ \hline & Annual Fixed Cost & $52,000 & \\ \hline & Unit Variable Cost & $9.00 & \\ \hline \multicolumn{4}{|l|}{ DECISION } \\ \hline & Quantity & 2,500 & \\ \hline \multicolumn{4}{|l|}{ OUTPUT } \\ \hline & Annual Profit (Loss) & ($12,000) & \\ \hline \multirow[t]{4}{*}{ CALCULATIONS } & & & C16: \\ \hline & Annual Revenue & $62,500 & C17: \\ \hline & Annual Variable Cost & $22,500 & C18: \\ \hline & Annual Total Cost & $74,500 & \\ \hline \end{tabular} (10 points) Download the "Fast Feet Shoes" spreadsheet from Canvas. Using the "Scenario Manager," create three scenarios of your own that each vary the three parameters (unit price, fixed cost, and variable cost) in some way. Present the results in a Scenario Summary sheet. (10 points) Download a clean (different) version of the "Fast Feet Shoes" spreadsheet from Canvas. Create a two-variable Data Table that shows what happens to Profit as the Annual Fixed Cost varies from $30,000 to $75,000, incrementing by $3,000 at a time; while Unit Variable Cost varies from $5.00 to $12.00, incrementing by $1.00 at a time. Put your Annual Fixed Cost values down the rows and put your Unit Variable Cost values across the columns. \begin{tabular}{|c|c|c|c|} \hline A & B & C & D \\ \hline \multicolumn{4}{|l|}{ Fast Feet Shoes } \\ \hline \multicolumn{4}{|c|}{ Profit/Loss Analysis } \\ \hline \multicolumn{4}{|l|}{ PARAMETERS } \\ \hline & Unit Sales Price & $25.00 & \\ \hline & Annual Fixed Cost & $52,000 & \\ \hline & Unit Variable Cost & $9.00 & \\ \hline \multicolumn{4}{|l|}{ DECISION } \\ \hline & Quantity & 2,500 & \\ \hline \multicolumn{4}{|l|}{ OUTPUT } \\ \hline & Annual Profit (Loss) & ($12,000) & \\ \hline \multirow[t]{4}{*}{ CALCULATIONS } & & & C16: \\ \hline & Annual Revenue & $62,500 & C17: \\ \hline & Annual Variable Cost & $22,500 & C18: \\ \hline & Annual Total Cost & $74,500 & \\ \hline \end{tabular}
Step by Step Solution
There are 3 Steps involved in it
Step: 1

Get Instant Access to Expert-Tailored Solutions
See step-by-step solutions with expert insights and AI powered tools for academic success
Step: 2

Step: 3
Ace Your Homework with AI
Get the answers you need in no time with our AI-driven, step-by-step assistance
Get Started