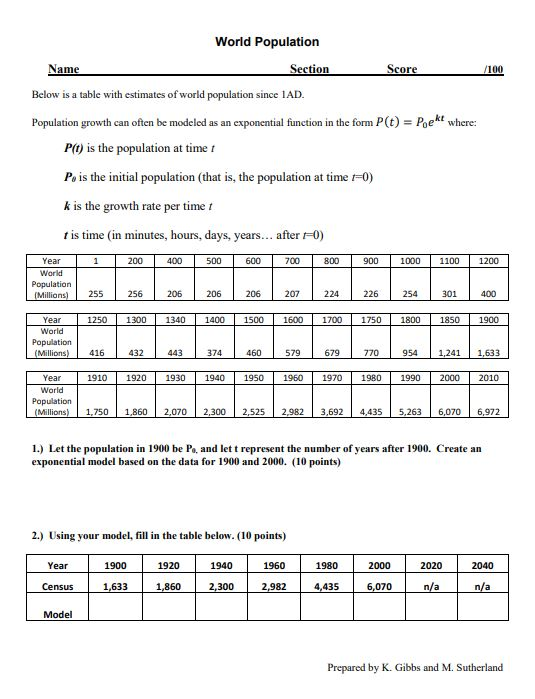
/100 World Population Name Section Score Below is a table with estimates of world population since IAD. Population growth can often be modeled as an exponential function in the form P(t) = Poekt where: P(t) is the population at timet Po is the initial population (that is, the population at time 0) k is the growth rate per timet t is time in minutes, hours, days, years... after 0) 1 200 400 500 600 700 800 900 1000 1100 1200 Year World Population [Millions) 255 256 206 206 206 207 224 226 254 301 400 1250 1300 1340 1400 1500 1600 1700 1750 1800 1850 1900 Year World Population (Millions) 416 432 443 374 460 579 679 770 954 1,241 1,633 1910 1920 1930 1940 1950 1960 1970 1980 1990 2000 2010 Year World Population (Millions) 1,750 1,860 2,070 2,300 2,525 2,982 3,692 4,435 5,263 6,070 6,972 t 1.) Let the population in 1900 be Pe and let t represent the number of years after 1900. Create an exponential model based on the data for 1900 and 2000. (10 points) 2.) Using your model, fill in the table below. (10 points) 1900 1920 1,633 1,860 2,300 2,982 Year 1940 1960 1980 2000 2020 2040 Census 4,435 6,070 n/a n/a Model Prepared by K. Gibbs and M. Sutherland 3.) The horizontal axis is labeled for you. Choose an appropriate scale for the vertical axis and graph your data from the table. Be sure to label which is the census data, and which is the model. (10 points) Population (millions) 1010 1920 1930 1940 1950 1960 1970 1950 1990 2000 2010 2020 2030 2040 4.) According to your model, in what year will the population reach 10 billion people? Lets create a second model using different years for data points. 5.) Let the population in 1940 be Pe and let t represent the number of years after 1940. Create an exponential model based on the data for 1940 and 1980. (10 points) 6.) Using your model, fill in the table below. (10 Points) Year 1900 1920 1940 1960 1980 2000 2020 2040 Census 1,633 1,860 2,300 2,982 4,435 6,070 n/a n/a Prepared by K. Gibbs and M. Sutherland Model 7.) The horizontal axis is labeled for you. Choose an appropriate scale for the vertical axis and graph your data from the table. Be sure to label which is the census data, and which is the model. (10 points) Apopulation (millions) 1910 1920 1930 1940 1959 1960 1970 1950 1990 2000 2010 2020 2030 2040 8.) According to this model, in what year will the population reach 10 billion people? (10 points) 9.) Which model (the one based on 1900-2000 or the one based on 1940-1980) is better? (10 points) 10.) Do you think either of your models will be accurate for the year 2050? Why? (10 points) Prepared by K. Gibbs and M. Sutherland /100 World Population Name Section Score Below is a table with estimates of world population since IAD. Population growth can often be modeled as an exponential function in the form P(t) = Poekt where: P(t) is the population at timet Po is the initial population (that is, the population at time 0) k is the growth rate per timet t is time in minutes, hours, days, years... after 0) 1 200 400 500 600 700 800 900 1000 1100 1200 Year World Population [Millions) 255 256 206 206 206 207 224 226 254 301 400 1250 1300 1340 1400 1500 1600 1700 1750 1800 1850 1900 Year World Population (Millions) 416 432 443 374 460 579 679 770 954 1,241 1,633 1910 1920 1930 1940 1950 1960 1970 1980 1990 2000 2010 Year World Population (Millions) 1,750 1,860 2,070 2,300 2,525 2,982 3,692 4,435 5,263 6,070 6,972 t 1.) Let the population in 1900 be Pe and let t represent the number of years after 1900. Create an exponential model based on the data for 1900 and 2000. (10 points) 2.) Using your model, fill in the table below. (10 points) 1900 1920 1,633 1,860 2,300 2,982 Year 1940 1960 1980 2000 2020 2040 Census 4,435 6,070 n/a n/a Model Prepared by K. Gibbs and M. Sutherland 3.) The horizontal axis is labeled for you. Choose an appropriate scale for the vertical axis and graph your data from the table. Be sure to label which is the census data, and which is the model. (10 points) Population (millions) 1010 1920 1930 1940 1950 1960 1970 1950 1990 2000 2010 2020 2030 2040 4.) According to your model, in what year will the population reach 10 billion people? Lets create a second model using different years for data points. 5.) Let the population in 1940 be Pe and let t represent the number of years after 1940. Create an exponential model based on the data for 1940 and 1980. (10 points) 6.) Using your model, fill in the table below. (10 Points) Year 1900 1920 1940 1960 1980 2000 2020 2040 Census 1,633 1,860 2,300 2,982 4,435 6,070 n/a n/a Prepared by K. Gibbs and M. Sutherland Model 7.) The horizontal axis is labeled for you. Choose an appropriate scale for the vertical axis and graph your data from the table. Be sure to label which is the census data, and which is the model. (10 points) Apopulation (millions) 1910 1920 1930 1940 1959 1960 1970 1950 1990 2000 2010 2020 2030 2040 8.) According to this model, in what year will the population reach 10 billion people? (10 points) 9.) Which model (the one based on 1900-2000 or the one based on 1940-1980) is better? (10 points) 10.) Do you think either of your models will be accurate for the year 2050? Why? (10 points) Prepared by K. Gibbs and M. Sutherland