Answered step by step
Verified Expert Solution
Question
1 Approved Answer
109. Table 3.20 gives the number of participants in the recent National Health Interview Survey who had been treated for cancer in the previous 12
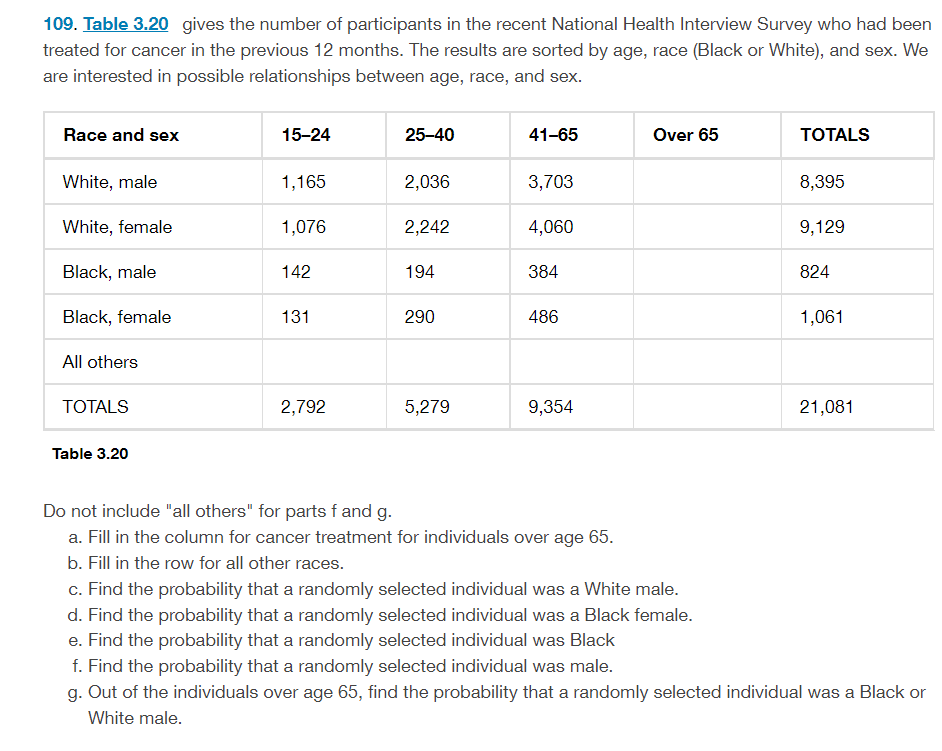
109. Table 3.20 gives the number of participants in the recent National Health Interview Survey who had been treated for cancer in the previous 12 months. The results are sorted by age, race (Black or White), and sex. We are interested in possible relationships between age, race, and sex. Race and sex 1524 2540 4165 Over 65 TOTALS White, male 1,165 2,036 3,703 8,395 White, female 1,0?6 2,242 4,060 9,129 Black, male 142 194 384 824 Black, female 131 290 486 1,061 All others TOTALS 2,?92 5,279 9,354 21 ,081 Table 3.20 Do not include "all others" for parts f and g. a. Fill in the column for cancer treatment for individuals over age 65. b. Fill in the row for all other races. c. Find the probability that a randomly selected individual was a White male. d. Find the probability that a randomly selected individual was a Black female. 9. Find the probability that a randomly selected individual was Black f. Find the probability that a randomly selected individual was male. 9. Out of the individuals over age 65, find the probability that a randomly selected individual was a Black or White male
Step by Step Solution
There are 3 Steps involved in it
Step: 1
Get Instant Access to Expert-Tailored Solutions
See step-by-step solutions with expert insights and AI powered tools for academic success
Step: 2
Step: 3
Ace Your Homework with AI
Get the answers you need in no time with our AI-driven, step-by-step assistance
Get Started