Answered step by step
Verified Expert Solution
Link Copied!

Question

1 Approved Answer

11. The concentration of A was monitored as a function of time during the course of the reaction: AC Plot the above data in excel
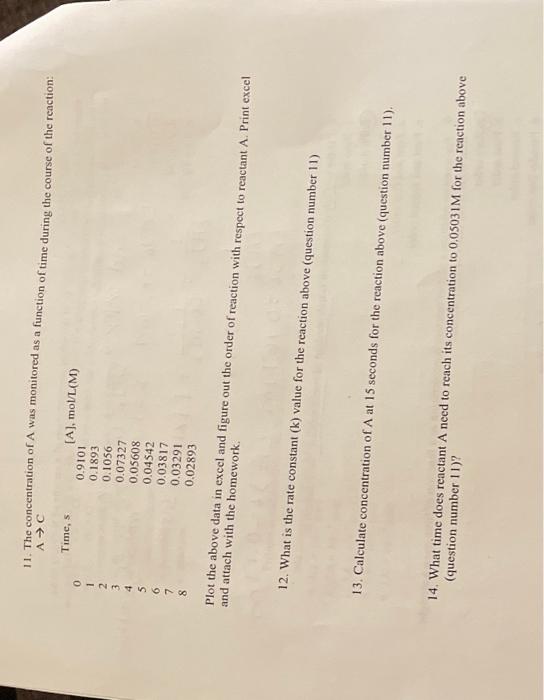
image text in transcribed
11. The concentration of A was monitored as a function of time during the course of the reaction: AC Plot the above data in excel and figure out the order of reaction with respect to reactant A. Print excel and attach with the homework. 12. What is the rate constant (k) value for the reaction above (question number 11) 13. Calculate concentration of A at 15 seconds for the reaction above (question number 11 ). 14. What time does reactant A need to reach its concentration to 0.05031M for the reaction above (question number 11 )

Step by Step Solution

There are 3 Steps involved in it

Step: 1

blur-text-image

Get Instant Access to Expert-Tailored Solutions

See step-by-step solutions with expert insights and AI powered tools for academic success

Step: 2

blur-text-image

Step: 3

blur-text-image

Ace Your Homework with AI

Get the answers you need in no time with our AI-driven, step-by-step assistance

Get Started

Recommended Textbook for

Fundamentals Of Analytical Chemistry

Authors: Douglas A. Skoog, Donald M. West, F. James Holler, Stanley R. Crouch

10th Edition

0357450396, 978-0357450390

More Books

Students also viewed these Chemistry questions