Answered step by step
Verified Expert Solution
Link Copied!

Question

1 Approved Answer

12. The following results were obtained for a powder by a sieving test: Represent in a diagram the particle size distribution. Calculate the mean size
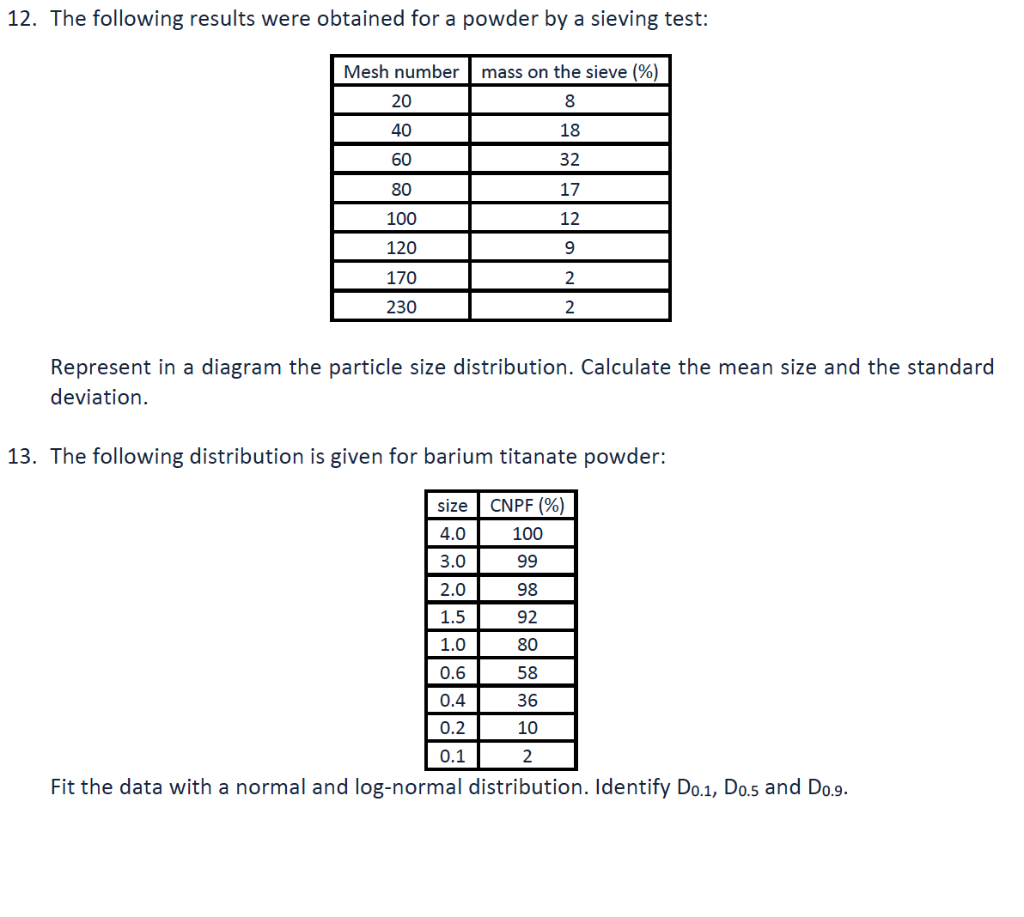
image text in transcribed

12. The following results were obtained for a powder by a sieving test: Represent in a diagram the particle size distribution. Calculate the mean size and the standard deviation. 13. The following distribution is given for barium titanate powder: Fit the data with a normal and log-normal distribution. Identify D0.1,D0.5 and D0.9

Step by Step Solution

There are 3 Steps involved in it

Step: 1

blur-text-image

Get Instant Access to Expert-Tailored Solutions

See step-by-step solutions with expert insights and AI powered tools for academic success

Step: 2

blur-text-image_2

Step: 3

blur-text-image_3

Ace Your Homework with AI

Get the answers you need in no time with our AI-driven, step-by-step assistance

Get Started

Recommended Textbook for

Introduction To Chemical Engineering Analysis Using Mathematica

Authors: Henry C. Foley

1st Edition

0122619129, 978-0122619120

More Books

Students also viewed these Chemical Engineering questions