Question
12. The manufacturer of a particular type of car claims that the engines in these cars can run for 100,000 miles without needing an oil
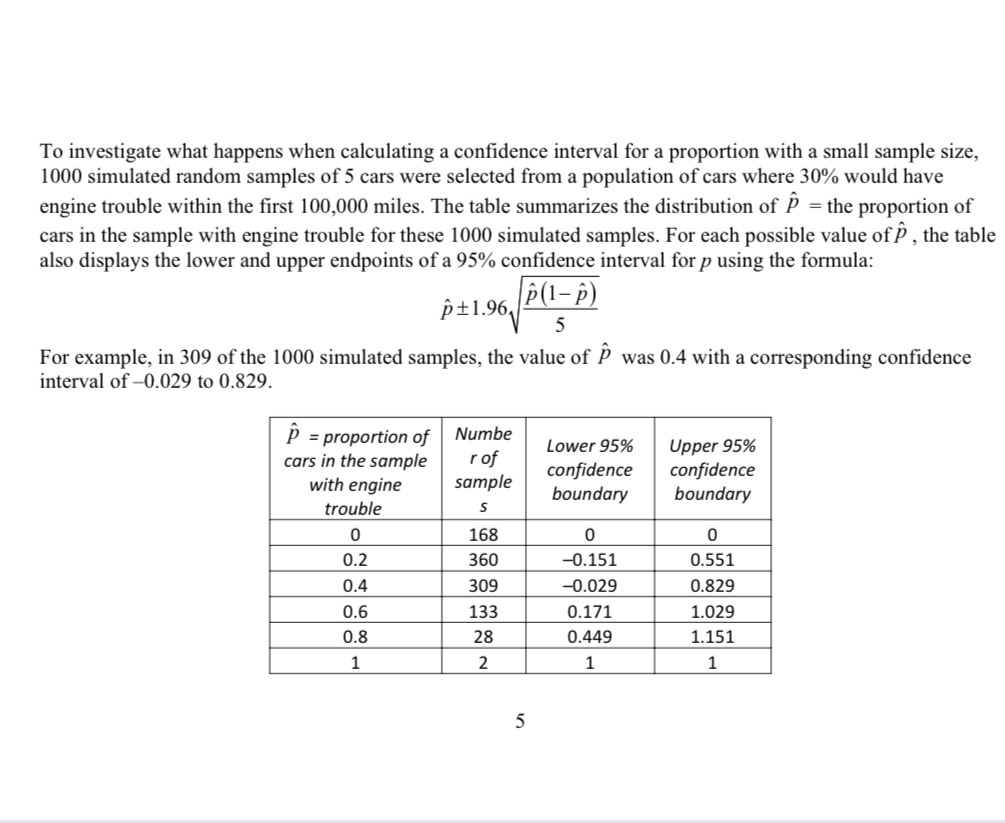
12. The manufacturer of a particular type of car claims that the engines in these cars can run for 100,000 miles without needing an oil change. To test this claim, a consumer organization plans to select a random sample of these cars and run them for 100,000 miles without an oil change, noting if any of the cars have any engine trouble during this period. Then, they will calculate a 95% confidence interval for the proportion of all cars of this type that will have engine trouble within the first 100,000 miles.(a) Explain what it means to be 95% confident in this context.(b) The consumer organization tests a random sample of 5 cars of this type and finds that 1 of the 5 cars had engine trouble within the first 100,000 miles. State and check the conditions for calculating a 95% confidence interval for the proportion of all cars of this type that would have engine trouble within the first 100,000 miles. Do not calculate the interval....after the photo below:(c) According to the simulation, how often will these 95% confidence intervals capture the true proportion of cars of this type that will have engine trouble in the first 100,000 miles? Explain how you determined your answer.(d) When the sample size is small, an alternative method for calculating a 95% confidence interval for aproportion involves adding 2 successes and 2 failures to the sample, calculating the value of p? using the original sample plus these 4 additional observations, and using the formula:p? ? 1 ? p? ? p? ?1.96(i) In the consumer organization's sample of 5 cars, 1 had engine trouble in the first 100,000 miles. What is thenvalue of p? that should be used to calculate the confidence interval for this sample, assuming that the alternativemethod is to be used?

Step by Step Solution
There are 3 Steps involved in it
Step: 1

Get Instant Access to Expert-Tailored Solutions
See step-by-step solutions with expert insights and AI powered tools for academic success
Step: 2

Step: 3

Ace Your Homework with AI
Get the answers you need in no time with our AI-driven, step-by-step assistance
Get Started


