Answered step by step
Verified Expert Solution
Question
1 Approved Answer
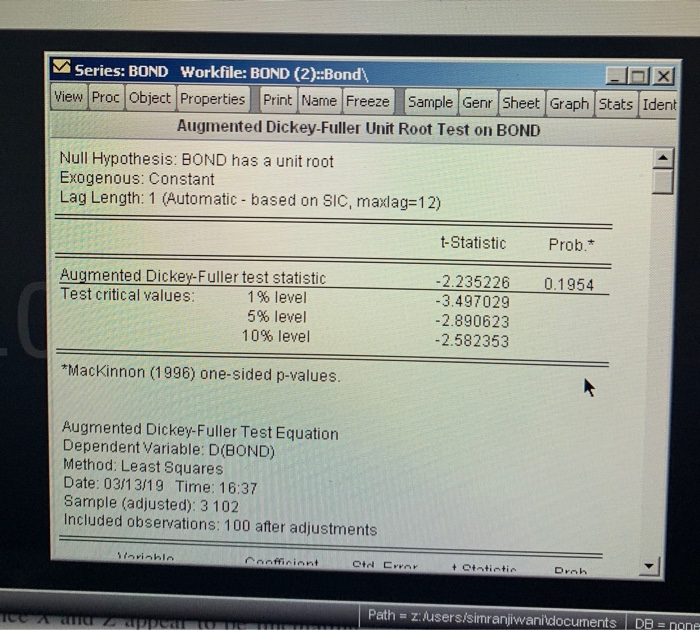
? 12.5 The data file bond.dat contains 102 monthly observations on AA railroad bond yields for the period January 1968 to June 1976. (a) Plot


 ?
?
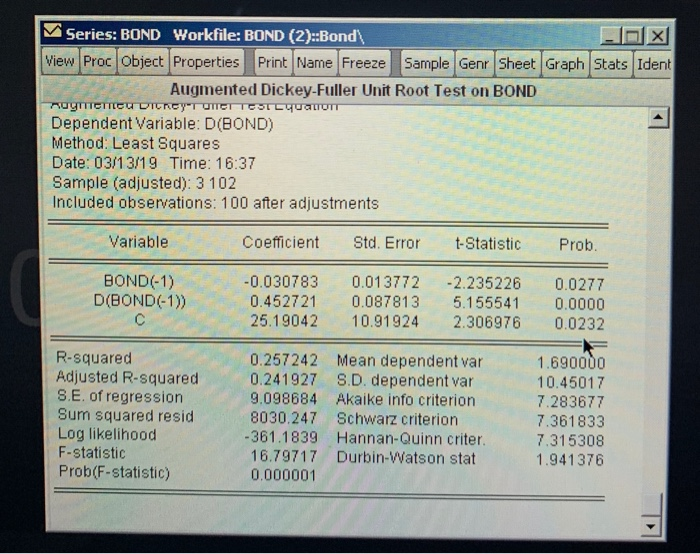
12.5 The data file bond.dat contains 102 monthly observations on AA railroad bond yields for the period January 1968 to June 1976. (a) Plot the data. Do railroad bond yields appear stationary, or nonstationary? (b) Use a unit root test to demonstrate that the series is nonstationary. (c) Find the first difference of the bond yield series and test for stationarity. (d) What do you conclude about the order of integration of this series? Series: BOND Workfile: BOND (2)::Bond\ X View Proc Object Properties Print Name Freeze Sample Genr Sheet Graph Stats Ident Augmented Dickey-Fuller Unit Root Test on BOND Null Hypothesis: BOND has a unit root Exogenous: Constant Lag Length: 1 (Automatic - based on SIC, maxlag=12) Augmented Dickey-Fuller test statistic Test critical values: 1% level 5% level 10% level C *MacKinnon (1996) one-sided p-values. Augmented Dickey-Fuller Test Equation Dependent Variable: D(BOND) Method: Least Squares Date: 03/13/19 Time: 16:37 Sample (adjusted): 3102 Included observations: 100 after adjustments Variable Ice A and Z appear to Confficient Otd Error t-Statistic -2.235226 -3.497029 -2.890623 -2.582353 + Ctntictic Prob.* 0.1954 Drah Path = z:/users/simranjiwani documents DB=none Series: BOND Workfile: BOND (2)::Bond\ HOX View Proc Object Properties Print Name Freeze Sample Genr Sheet Graph Stats Ident Augmented Dickey-Fuller Unit Root Test on BOND Augmemeu Dickey Tuner Test EquationT Dependent Variable: D(BOND) Method: Least Squares Date: 03/13/19 Time: 16:37 Sample (adjusted): 3102 Included observations: 100 after adjustments Variable. BOND(-1) D(BOND(-1)) R-squared Adjusted R-squared S.E. of regression Sum squared resid Log likelihood F-statistic Prob(F-statistic) Coefficient Std. Error t-Statistic -0.030783 0.013772 -2.235226 0.452721 0.087813 5.155541 25.19042 10.91924 2.306976 0.257242 0.241927 9.098684 8030.247 Schwarz criterion -361.1839 Hannan-Quinn criter. 16.79717 Durbin-Watson stat 0.000001 Mean dependent var S.D. dependent var Akaike info criterion. Prob. 0.0277 0.0000 0.0232 1.690000 10.45017 7.283677 7.361833 7.315308 1.941376
Step by Step Solution
★★★★★
3.42 Rating (152 Votes )
There are 3 Steps involved in it
Step: 1
ECON 125 2 The data file bondwfl contains 102 monthly observations on AA railroad bond yields for the period January 1968 to June 1976 a Plot the data Do the data look stationary or nonstationary it looks nonstationary b Use a unit root test to demonstrate that the series is nonstationary Ha reo Test statatistic p valne o 1954 Fail to reject Ho the series is nonstationary c Find the first difference of the bond yield ...
Get Instant Access to Expert-Tailored Solutions
See step-by-step solutions with expert insights and AI powered tools for academic success
Step: 2

Step: 3

Ace Your Homework with AI
Get the answers you need in no time with our AI-driven, step-by-step assistance
Get Started


