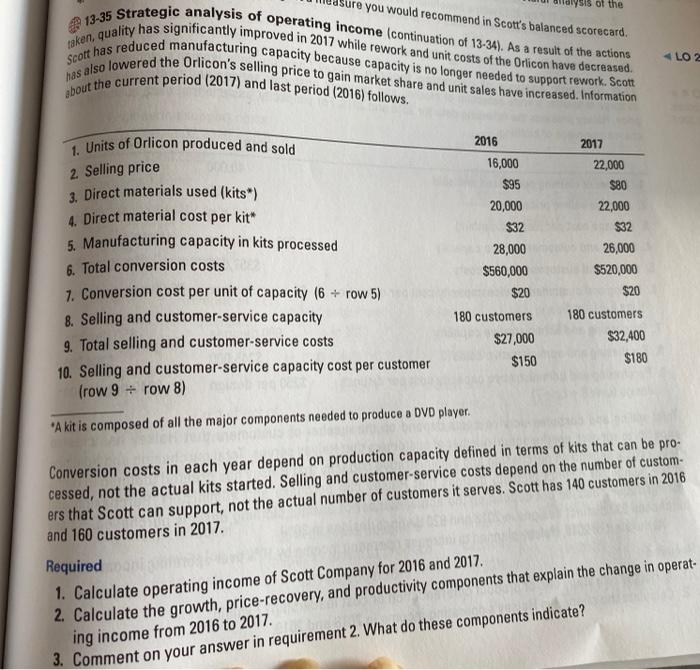
13-35 Strategic analysis of operating income (continuation of 13-34). As a result of the actions saken, quality has significantly improved in 2017 while rework and unit costs of the Orlicon have decreased has also lowered the Orlicon's selling price to gain market share and unit sales have increased. Information Scott has reduced manufacturing capacity because capacity is no longer needed to support rework. Scott sbout the current period (2017) and last period (2016) follows. 1. Units of Orlicon produced and sold sure you would recommend in Scott's balanced Scorecard. of the LO2 2016 2017 2. Selling price 3. Direct materials used (kits*) 4. Direct material cost per kit 5. Manufacturing capacity in kits processed 6. Total conversion costs 7. Conversion cost per unit of capacity (6 + row 5) 8. Selling and customer-service capacity 9. Total selling and customer-service costs 10. Selling and customer-service capacity cost per customer (row 9 + row 8) 16,000 $95 20,000 $32 28,000 $560,000 $20 180 customers $27,000 $150 22,000 $80 22,000 $32 26,000 $520,000 $20 180 customers $32,400 $180 A kit is composed of all the major components needed to produce a DVD player. Conversion costs in each year depend on production capacity defined in terms of kits that can be pro- cessed, not the actual kits started. Selling and customer-service costs depend on the number of custom- ers that Scott can support, not the actual number of customers it serves. Scott has 140 customers in 2016 and 160 customers in 2017. Required 1. Calculate operating income of Scott Company for 2016 and 2017, 2. Calculate the growth, price-recovery, and productivity components that explain the change in operat- ing income from 2016 to 2017. 3. Comment on your answer in requirement 2. What do these components indicate