Answered step by step
Verified Expert Solution
Question
1 Approved Answer
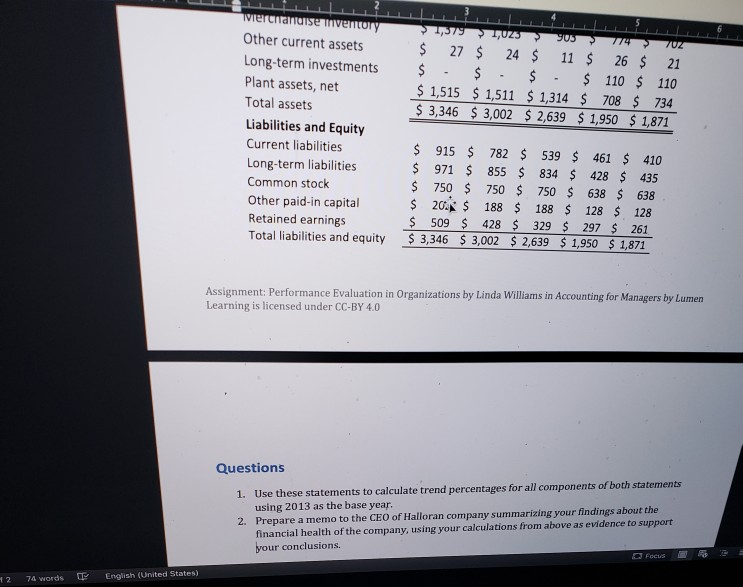
1,379 LUZS y us 114 YUZ $ 27 $ 24 $ 11 $ 26 $ 21 $ - $ - $ - $ 110 $


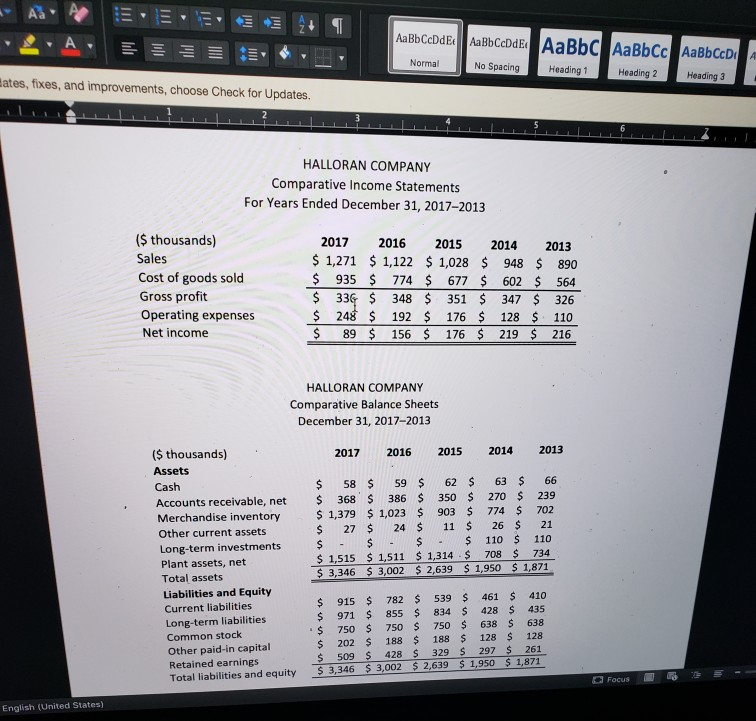
1,379 LUZS y us 114 YUZ $ 27 $ 24 $ 11 $ 26 $ 21 $ - $ - $ - $ 110 $ 110 $ 1,515 $ 1,511 $ 1,314 $ 708 $ 734 $ 3,346 $ 3,002 $ 2,639 $ 1,950 $ 1,871 wiercianise Tventory Other current assets Long-term investments Plant assets, net Total assets Liabilities and Equity Current liabilities Long-term liabilities Common stock Other paid-in capital Retained earnings Total liabilities and equity $ 915 $ 782 $ 539 $ 461 $ 410 $ 971 $ 855 $ 834 $ 428 $ 435 $ 750 $ 750 $ 750 $ 638 $ 638 $ 20 $ 188 $ 188 $ 128 $ 128 $ 509 $ 428 $ 329 $ 297 $ 261 $ 3,346 $ 3,002 $ 2,639 $ 1,950 $ 1,871 Assignment: Performance Evaluation in Organizations by Linda Williams in Accounting for Managers by Lumen Learning is licensed under CC-BY 4.0 Questions 1. Use these statements to calculate trend percentages for all components of both statements using 2013 as the base year. 2. Prepare a memo to the CEO of Halloran company summarizing your findings about the financial health of the company, using your calculations from above as evidence to support your conclusions. Focus 3 42 74 words English (United States) AaBbCcDdEe | Aa BbCcDdEt AaBbc AaBbcc AaBbccdi No Spacing Heading 1 Heading 2 Heading 3 Normal ates, fixes, and improvements, choose Check for Updates HALLORAN COMPANY Comparative Income Statements For Years Ended December 31, 2017-2013 ($ thousands) Sales Cost of goods sold Gross profit Operating expenses Net income 2017 2016 2015 2014 2013 $ 1,271 $ 1,122 $ 1,028 $ 948 $ 890 $ 935 $ 774 $ 677 $ 602 $ 564 $ 336 $ 348 $ 351 $ 347 $ 326 $ 248 $ 192 $ 176 $ 128 $ 110 $ 89 $ 156 $ 176 $ 219 $ 216 HALLORAN COMPANY Comparative Balance Sheets December 31, 2017-2013 2017 2016 2015 2014 2013 ($ thousands) Assets Cash Accounts receivable, net Merchandise inventory Other current assets Long-term investments Plant assets, net Total assets Liabilities and Equity Current liabilities Long-term liabilities Common stock Other paid in capital Retained earnings Total liabilities and equity $ 58 $ 59 $ 62 $ 63 $ 66 $ 368 $ 386 $ 350 $ 270 $ 239 $ 1,379 $ 1,023 $ 903 $ 774 $ 702 $ 27 $ 24 $ 11 $ 26 $ 21 $ - $ - $ - $ 110 $ 110 $ 1,515 $ 1,511 $ 1,314 $ 708 $ 734 $ 3,346 $ 3,002 $ 2,639 $ 1,950 $ 1,871 $ 915 $ 782 $ 539 $ 461 $ 410 $ 971 $ 855 $ 834 S 428 $ 435 $ 750 $ 750 $ 750 $ 638 $ 638 $ 202 $ 188 $ 188 $ 128 $ 128 $ 509 $ 428 $ 329 S 297 $ 261 $ 3,346 $ 3,002 $ 2,639 $ 1.950 $ 1871 Focus RS 3 - English (United States)
Step by Step Solution
There are 3 Steps involved in it
Step: 1

Get Instant Access to Expert-Tailored Solutions
See step-by-step solutions with expert insights and AI powered tools for academic success
Step: 2

Step: 3

Ace Your Homework with AI
Get the answers you need in no time with our AI-driven, step-by-step assistance
Get Started


