

Answered step by step
Verified Expert Solution
Question
1 Approved Answer
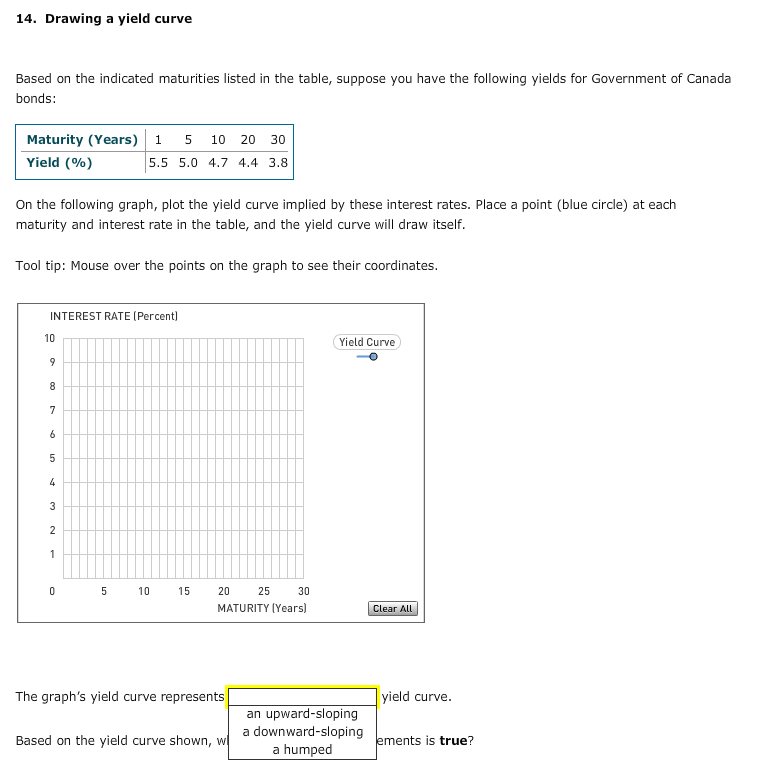
14. Drawing a yield curve Based on the indicated maturities listed in the table, suppose you have the following yields for Government of Canada bonds:
Step by Step Solution
There are 3 Steps involved in it
Step: 1

Get Instant Access to Expert-Tailored Solutions
See step-by-step solutions with expert insights and AI powered tools for academic success
Step: 2

Step: 3
Ace Your Homework with AI
Get the answers you need in no time with our AI-driven, step-by-step assistance
Get Started
Ethics In Finance Case Studies From A Womans Life On Wall Street
Authors: Kara Tan Bhala
1st Edition
3030737535, 978-3030737535