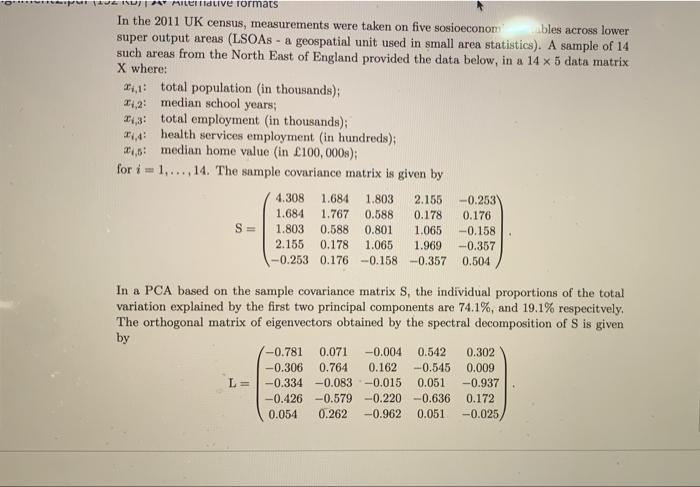
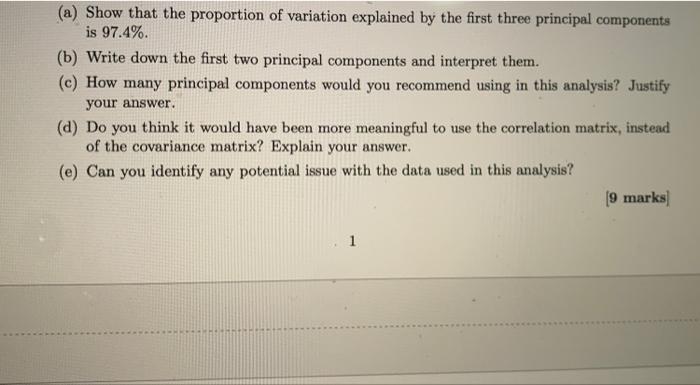
14 Merdive formats In the 2011 UK census, measurements were taken on five sosioeconom bles across lower super output areas (LSOAs - a geospatial unit used in small area statistics). A sample of 14 such areas from the North East of England provided the data below, in a 14 x 5 data matrix X where: 4,1: total population (in thousands); 42: median school years; 2,3: total employment in thousands); 14 health services employment in hundreds); 2,5 median home value in 100,000s); for i = 1,...,14. The sample covariance matrix is given by 4.308 1.684 1.803 2.155 -0.253 1.684 1.767 0.588 0.178 0.176 1.803 0.588 0.801 1.065 -0.158 2.155 0.178 1.065 1.969 -0.357 -0.253 0.176 -0.158 -0.357 0.504 S= In a PCA based on the sample covariance matrix S, the individual proportions of the total variation explained by the first two principal components are 74.1%, and 19.1% respectvely, The orthogonal matrix of eigenvectors obtained by the spectral decomposition of S is given by -0.781 0.071 -0.004 0.542 0.302 -0.306 0.764 0.162 -0.545 0.009 L= -0.334 -0.083 -0.015 0.051 -0.937 -0.426 -0.579 -0.220 -0.636 0.172 0.054 0.262 -0.962 0.051 -0.025 (a) Show that the proportion of variation explained by the first three principal components is 97.4% (b) Write down the first two principal components and interpret them. (c) How many principal components would you recommend using in this analysis? Justify your answer. (a) Do you think it would have been more meaningful to use the correlation matrix, instead of the covariance matrix? Explain your answer. (e) Can you identify any potential issue with the data used in this analysis? (9 marks 1 14 Merdive formats In the 2011 UK census, measurements were taken on five sosioeconom bles across lower super output areas (LSOAs - a geospatial unit used in small area statistics). A sample of 14 such areas from the North East of England provided the data below, in a 14 x 5 data matrix X where: 4,1: total population (in thousands); 42: median school years; 2,3: total employment in thousands); 14 health services employment in hundreds); 2,5 median home value in 100,000s); for i = 1,...,14. The sample covariance matrix is given by 4.308 1.684 1.803 2.155 -0.253 1.684 1.767 0.588 0.178 0.176 1.803 0.588 0.801 1.065 -0.158 2.155 0.178 1.065 1.969 -0.357 -0.253 0.176 -0.158 -0.357 0.504 S= In a PCA based on the sample covariance matrix S, the individual proportions of the total variation explained by the first two principal components are 74.1%, and 19.1% respectvely, The orthogonal matrix of eigenvectors obtained by the spectral decomposition of S is given by -0.781 0.071 -0.004 0.542 0.302 -0.306 0.764 0.162 -0.545 0.009 L= -0.334 -0.083 -0.015 0.051 -0.937 -0.426 -0.579 -0.220 -0.636 0.172 0.054 0.262 -0.962 0.051 -0.025 (a) Show that the proportion of variation explained by the first three principal components is 97.4% (b) Write down the first two principal components and interpret them. (c) How many principal components would you recommend using in this analysis? Justify your answer. (a) Do you think it would have been more meaningful to use the correlation matrix, instead of the covariance matrix? Explain your answer. (e) Can you identify any potential issue with the data used in this analysis? (9 marks 1