

Answered step by step
Verified Expert Solution
Question
1 Approved Answer
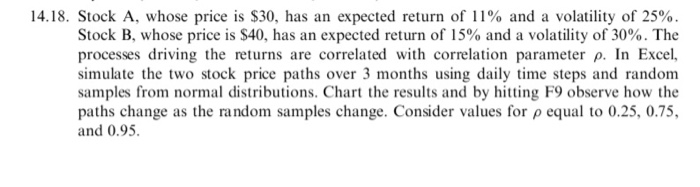
14.18. Stock A, whose price is $30, has an expected return of 11% and a volatility of 25%. Stock B, whose price is $40, has
Step by Step Solution
There are 3 Steps involved in it
Step: 1

Get Instant Access to Expert-Tailored Solutions
See step-by-step solutions with expert insights and AI powered tools for academic success
Step: 2

Step: 3
Ace Your Homework with AI
Get the answers you need in no time with our AI-driven, step-by-step assistance
Get Started
Managerial Finance Essentials
Authors: Charles O. Kroncke, Alan E. Grunewald, Erwin Esser Nemmers
2nd Edition
0829901590, 978-0829901597